Wir nutzen Cookies für Dinge wie Live-Chat-Support und um Ihnen Inhalte zu zeigen, die Sie wahrscheinlich interessieren. Wenn Sie mit der Verwendung von Cookies durch markets.com einverstanden sind, klicken Sie bitte auf „Annehmen“.
CFDs sind komplexe Instrumente und umfassen aufgrund der Hebelfinanzierung ein hohes Risiko, schnell Geld zu verlieren. 77,3% der Privatanlegerkonten verlieren Geld, wenn sie mit diesem Anbieter CFDs handeln. Sie sollten überlegen, ob Sie wirklich verstehen, wie CFDs funktionieren, und ob Sie es sich leisten können, das hohe Risiko von finanziellen Verlusten einzugehen.
Mittwoch Apr 12 2023 10:02

3 min
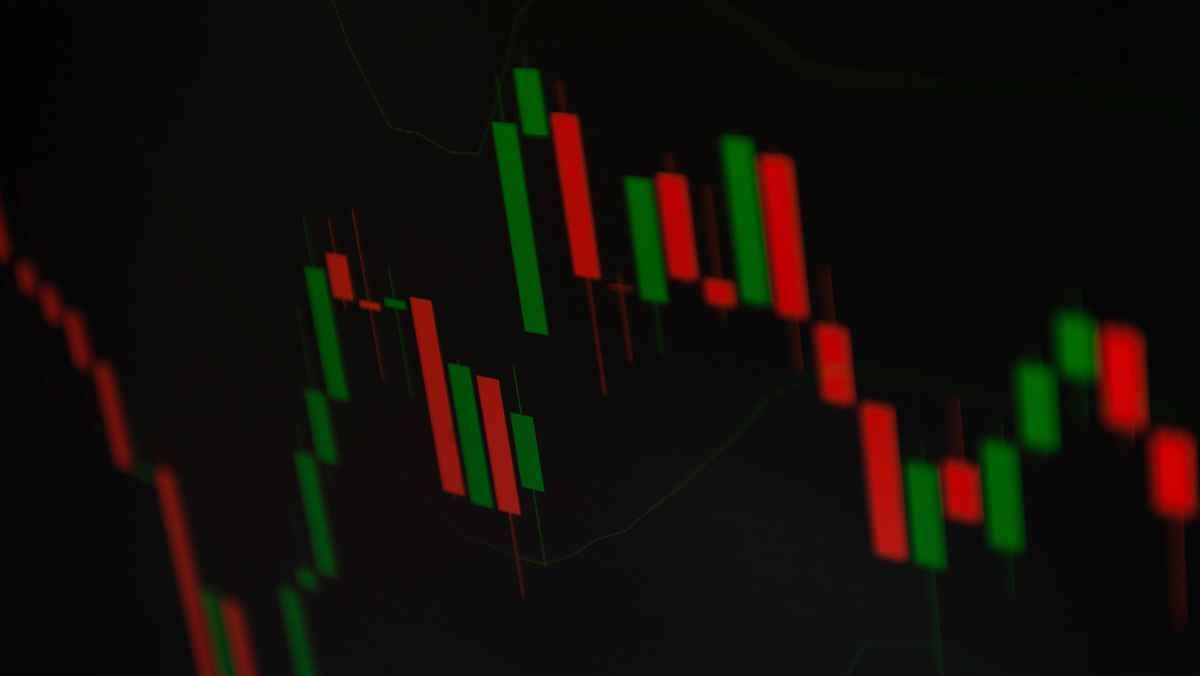
Bollinger Bands are one of the most widely used and powerful technical indicators in the financial markets. Named after the creator, John Bollinger, these bands are made up of a series of bands placed at a certain distance around a certain Moving Average, generally a 20 period MA, that capture the dynamics of volatility in a certain security or market index.
To calculate Bollinger Bands, one takes a certain MA, the 20 period MA is common, and calculates two “bands” a certain distance from that MA, which is calculated by the volatility of the security. For example, the common distance to set the bands is two standard deviations.
This can be calculated in two ways: with historical volatility and a “squeeze” indicator.
The formula for Bollinger Bands can be broken down into three main parts. The first is the MA. As stated, this is generally a 20 period moving average of closing prices. This MA will then be set by the two bands which will be the distances from the MA. These two bands are the Upper and Lower Band, which are set two standard deviations from the MA.


Join the 100.000s that have made markets.com their home for trading. Learn about trading as you grow your portfolio.
More power in our platforms
Wir können derzeit keine Kunden aus Ihrem Land annehmen. Falls Sie diese Nachricht fälschlicherweise erhalten haben, setzen Sie sich bitte mit unserem Support-Team per E-Mail an support@markets.com in Verbindung.
Support kontaktieren
The limitation of Bollinger Bands is that, like many technical indicators, they can generate false signals that do not accurately indicate the movement of the security. Bollinger Bands, therefore, must be used in combination with other indicators to confirm or negate the signals given.
In addition, Bollinger Bands do not necessarily accurately reflect changes in the underlying security or market, but are merely a measure of volatility, which is itself an abstract concept. Therefore, it is important to use them in conjunction with other technical analysis techniques.

In conclusion, Bollinger Bands are an extremely powerful technical indicator and are a staple of technical analysis. While the bands alone cannot give an accurate measure of the underlying security, they can be used in conjunction with other indicators and tools to generate trading signals and inform one’s decisions in the markets.
It is important to note, however, that false signals can be generated and one must be careful when making any trading decision.
Liste aller Werte
Ganze Liste ansehenNeueste
Alles ansehen
Donnerstag, 24 April 2025

7 min

Donnerstag, 24 April 2025

6 min

Donnerstag, 24 April 2025

7 min