Kamis Mei 8 2025 07:10

4 min

The Bank of England's most recent interest rate decision held the benchmark rate at 4.5%, while markets anticipate a potential cut to 4.25% at the upcoming meeting today at 11:00 GMT. This expectation is largely driven by signs of cooling inflation, weaker-than-expected economic growth, and increasing pressure on households and businesses due to high borrowing costs. With headline inflation continuing to ease toward the BoE’s 2% target and wage growth moderating, policymakers may see room to begin cautiously unwinding prior rate hikes to support economic activity without reigniting price pressures.

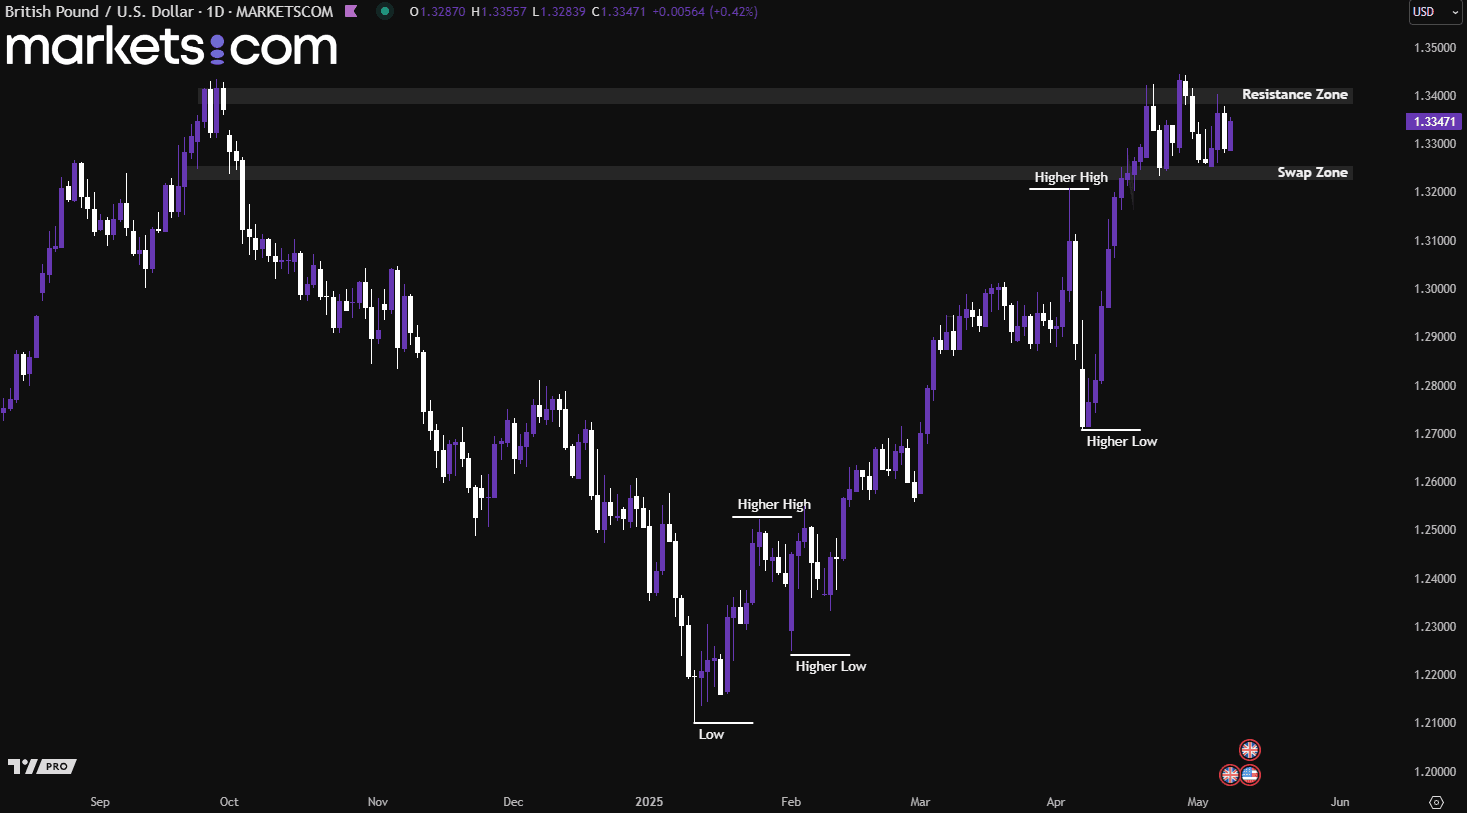
(GBP/USD Daily Chart, Source: Trading View)
From a technical analysis perspective, the GBP/USD currency pair has been in a bullish trend since mid-January 2025, as indicated by the formation of higher lows and higher highs. In the near term, it has been oscillating between the swap zone of 1.3220 – 1.3260 and the resistance zone of 1.3380 – 1.3420 since April 18. A momentum-driven breakout to either side could potentially lead the currency pair to continue moving in that direction.
Last week, U.S. initial jobless claims came in at 241,000, while the forecast for this week is slightly lower at 240,000. This modest decline suggests that labour market conditions remain relatively stable despite broader economic uncertainties. Although jobless claims have edged higher than earlier in the year, the expected slight drop reflects ongoing resilience in employment, with employers still cautious about layoffs amid a tight labour market. This data is set to be released today at 12:30 GMT.

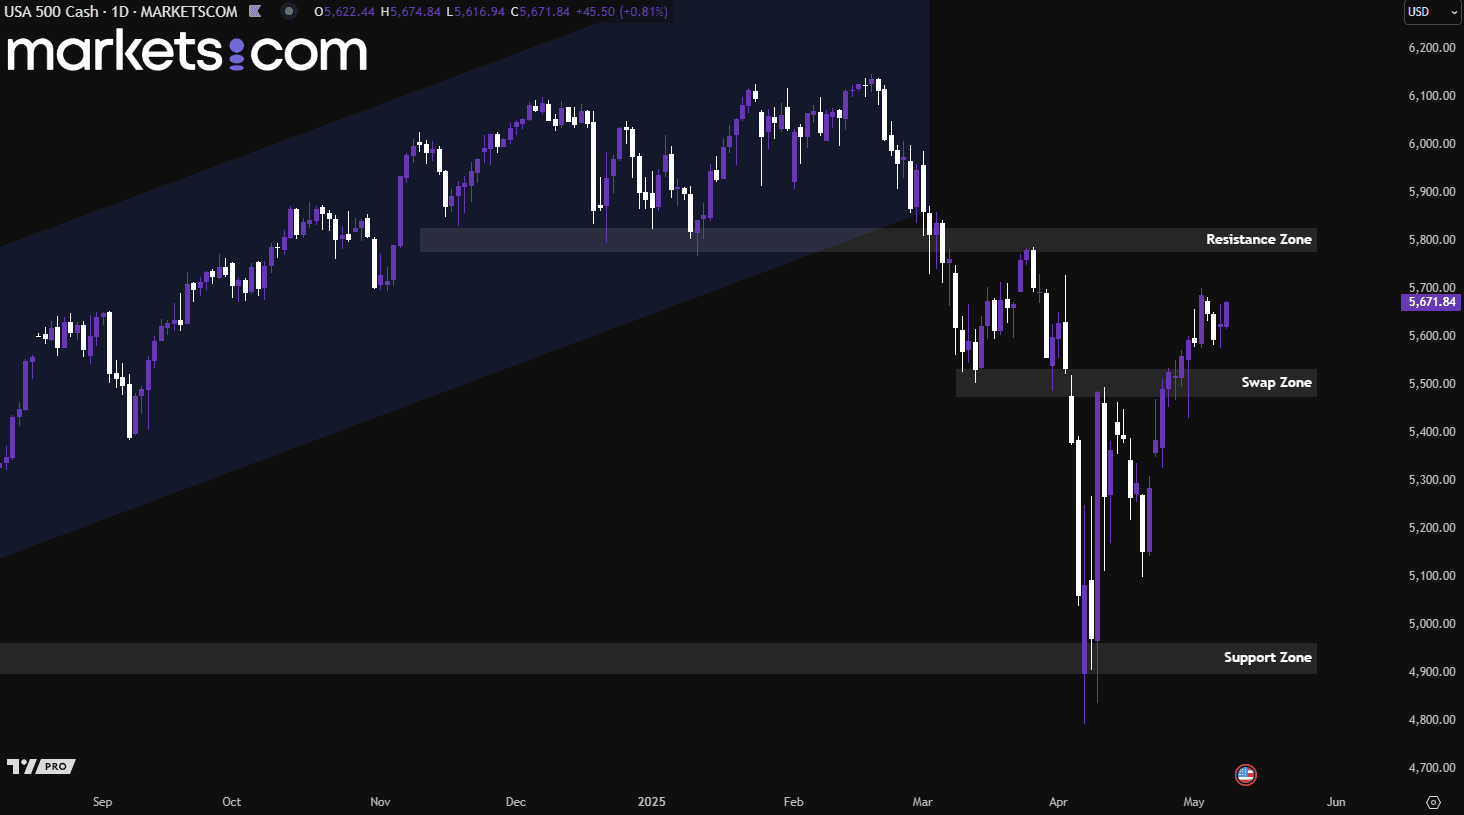
(S&P 500 Index Daily Chart, Source: Trading View)
From a technical analysis perspective, the S&P 500 index has been in a bearish trend since mid-February 2025. However, it rebounded from a support zone in early April 2025 with strong bullish momentum and is now exhibiting a bullish trend, as indicated by a pattern of higher highs and higher lows. Recently, the index broke above the swap zone between 5,475 and 5,535. This continued bullish momentum suggests the potential for an upward move to retest the resistance zone between 5,770 and 5,830.
Toyota Motor Corporation (TM) is set to announce its fourth-quarter fiscal 2025 results today after the market closes. It is expected to announce earnings of $2.92 per share on revenues of $78.47 billion for the quarter. While the revenue estimate points to a 5.24% year-over-year increase, the earnings outlook is less optimistic. Over the past 90 days, the consensus earnings estimate has been revised downward by $1.17, indicating a projected 41.48% decline from the same period last year. Moreover, TM has a strong earnings surprise history, beating estimates in three of the past four quarters, with an average surprise of 56.20%.
Looking ahead, Toyota forecasts fiscal 2025 operating income to reach ¥4.7 trillion, marking a 12.2% decline from the previous year. The expected contraction is attributed to increased investments in human capital and strategic growth initiatives, which are anticipated to weigh on profitability. These pressures are likely already reflected in the upcoming quarterly results, contributing to the weaker bottom-line expectations.

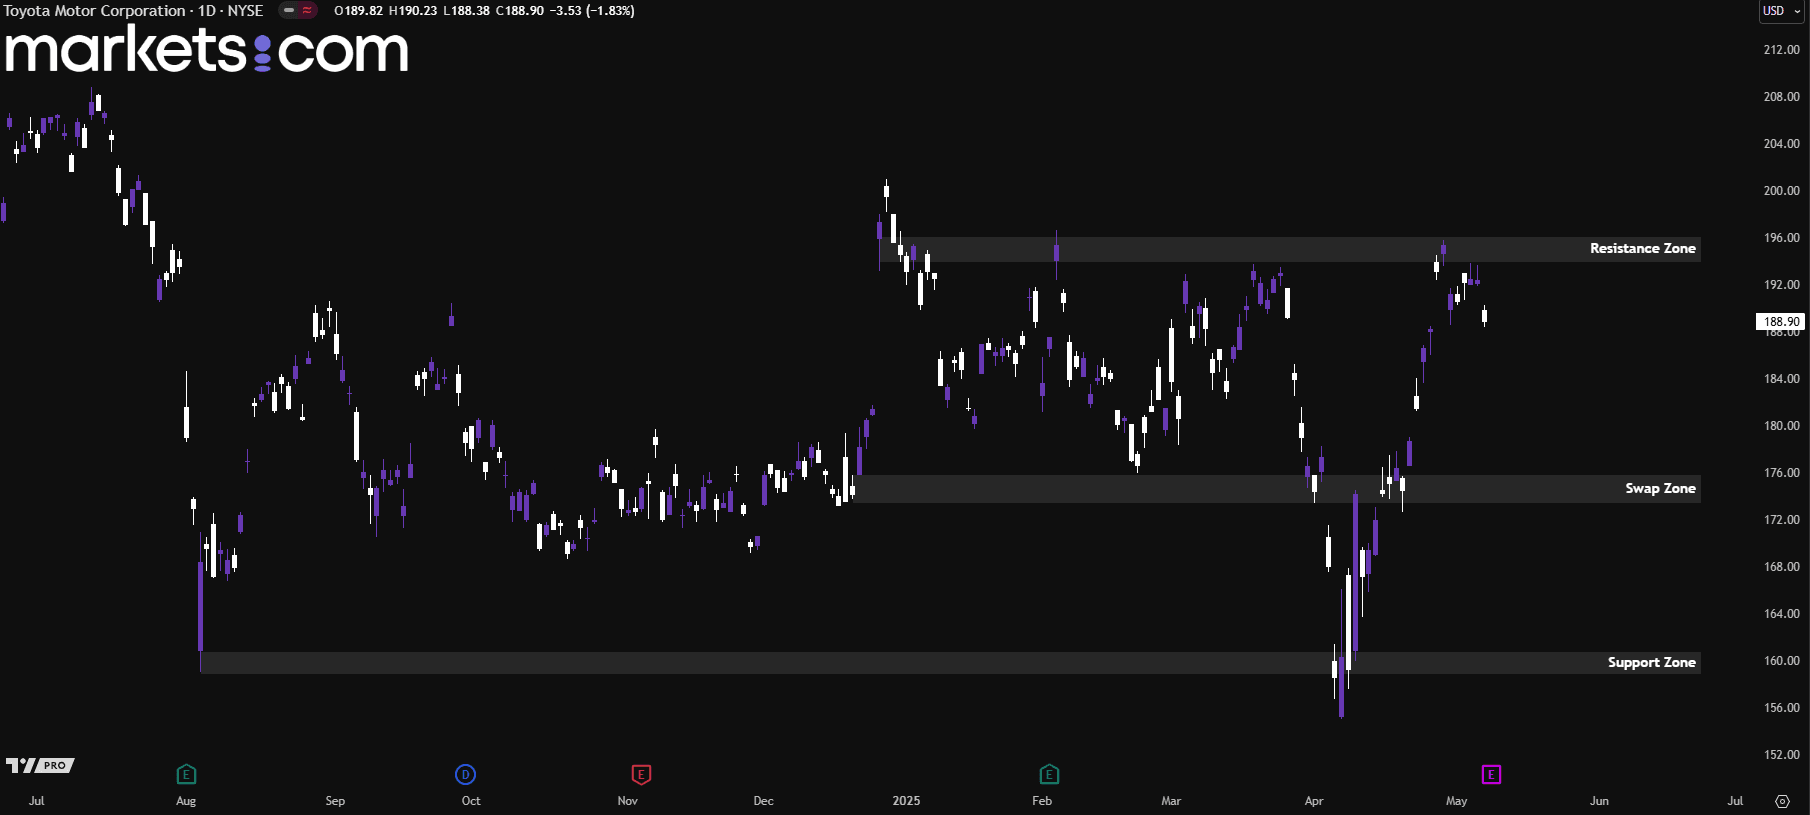
(Toyota Share Price Daily Chart, Source: Trading View)
From a technical analysis perspective, Toyota's share price has rebounded from the support zone of 159 – 161 since early April 2025, surging with bullish momentum to retest the resistance zone of 194 – 196. However, it was recently rejected by bearish pressure from the resistance zone, driving the price downward. If the price fails to break through the resistance zone in the near term, it may signal that the bullish momentum has been exhausted, and bearish forces could be regaining control, potentially pushing the price down to retest the swap zone of 173 – 176.
Risk Warning and Disclaimer: This article represents only the author’s views and is for reference only. It does not constitute investment advice or financial guidance, nor does it represent the stance of the Markets.com platform. Trading Contracts for Difference (CFDs) involves high leverage and significant risks. Before making any trading decisions, we recommend consulting a professional financial advisor to assess your financial situation and risk tolerance. Any trading decisions based on this article are at your own risk.