
Access Restricted for EU Residents
You are attempting to access a website operated by an entity not regulated in the EU. Products and services on this website do not comply with EU laws or ESMA investor-protection standards.
As an EU resident, you cannot proceed to the offshore website.
Please continue on the EU-regulated website to ensure full regulatory protection.
Friday Jul 17 2026 07:20

37 min

To trade the Nasdaq 100 from the UAE, you open an account with a regulated CFD broker, find the index under its platform name — usually US Tech 100 — analyse what's driving US tech, and place a buy or sell trade with a stop loss attached, typically during the US session that runs through the UAE evening. The Nasdaq-100 tracks the 100 largest non-financial companies on the Nasdaq exchange, which makes it the world's flagship technology index — and one of the most actively traded benchmarks anywhere, according to Capital.com's 2025 trading review.
This guide covers Nasdaq 100 trading from the ground up: what the index is (and isn't), what moves it, the ways to trade it, its hours in Gulf Standard Time, and a step-by-step path to your first trade.
The Nasdaq-100 is a stock index that tracks the 100 largest non-financial companies listed on the Nasdaq exchange in New York. Launched in 1985, it has become the world's benchmark for large-cap technology and growth: the companies inside it build the phones, chips, cloud platforms, and AI models the global economy runs on. On trading platforms you'll usually see it listed as the US Tech 100, and in market commentary as NDX or NAS100.
# | Company | Symbol | Weight | Price | Chg | % Chg |
|---|---|---|---|---|---|---|
1 | Nvidia Corp | NVDA | 12.31% | 207.4 | -5.1 | -2.40% |
2 | Apple Inc. | AAPL | 11.99% | 333.26 | 5.76 | 1.76% |
3 | Microsoft Corp | MSFT | 7.30% | 401.15 | 5.47 | 1.38% |
4 | Amazon.Com Inc | AMZN | 6.59% | 249.89 | -5.07 | -1.99% |
5 | Alphabet Inc. Class A Common Stock | GOOGL | 5.47% | 354.46 | -16.46 | -4.44% |
6 | Alphabet Inc. Class C Capital Stock | GOOG | 5.12% | 353.81 | -16.4 | -4.43% |
7 | Broadcom Inc. Common Stock | AVGO | 4.37% | 374.45 | -19.83 | -5.03% |
8 | Space Exploration Technologies Corp. Class A Common Stock | SPCX | 4.23% | 131.11 | -4.16 | -3.08% |
9 | Meta Platforms, Inc. Class A Common Stock | META | 4.13% | 664.54 | -16.77 | -2.46% |
10 | Tesla, Inc. Common Stock | TSLA | 3.60% | 391.06 | -3.4 | -0.86% |
Source: Slickcharts
Here's the confusion worth clearing up early, because it trips up plenty of new traders. The Nasdaq-100 is not the same thing as the Nasdaq Composite. The Composite is the exchange's everything-index — thousands of listed companies of every size, which is the number US news anchors usually quote. The Nasdaq-100 is the curated top slice: the hundred biggest non-financials, no banks or insurers, refreshed through regular rebalances. When traders talk about "trading the Nasdaq", they almost always mean the Nasdaq-100 — it's the version with deeply liquid futures, ETFs, and CFDs built on it.
One more distinction matters: you can't buy the index itself. It's a calculated number, not an asset. Trading it means using an instrument that tracks its price — which is where CFDs, ETFs, and futures come in below. For the broader foundations, our pillar guide on how to trade indices covers index trading across every major benchmark.
Want to see the index live before reading on? You can open a free demo account and watch the US Tech 100 tick through a US session with virtual funds — no risk, no commitment.
Get a generous deposit bonus on your first trade with Markets.com. Hurry—claim yours today!

Understanding what's inside the Nasdaq-100 tells you how it behaves — and that behaviour is the whole reason traders favour it.
The index is modified market-cap weighted: bigger companies move it more, with weighting caps in the methodology to stop any single name dominating outright. In practice, a handful of mega-cap technology companies — names like Apple, Microsoft, Nvidia, Amazon, Alphabet, Meta, and Tesla — carry a large share of the index's weight. When two or three of them report earnings in the same week, the index can move meaningfully on those results alone.
That concentration gives the Nasdaq-100 a distinct personality compared with its US siblings:
Index | What it tracks | Character |
|---|---|---|
Nasdaq-100 (US Tech 100) | 100 largest Nasdaq non-financials | Tech/growth heavy, most rate-sensitive, most volatile of the three |
Nasdaq Composite | Thousands of Nasdaq-listed companies | Broad exchange barometer; quoted in news, rarely traded directly |
S&P 500 (US 500) | 500 largest US companies, all sectors | The diversified world benchmark; steadier |
The practical read: the Nasdaq-100 typically moves further and faster than the S&P 500 in both directions — outperforming when tech leads, falling harder when rates rise or sentiment sours. That amplified behaviour is the attraction for active traders, and the hazard. If you'd rather trade the broader, steadier benchmark, see how to trade the S&P 500; many UAE traders follow both.
The Nasdaq-100 distils the state of global technology into one price. Four forces do most of the work:
Mega-cap tech earnings. Because of the cap-weighting, results from the largest constituents are index-level events, and earnings season — four times a year — is the Nasdaq-100's high season.
US interest rates. This is the big one. Tech valuations rest on profits expected years in the future, and higher rates make those future profits worth less today. That's why the index reacts so sharply to Federal Reserve decisions, inflation prints, and jobs data — rate expectations are its heartbeat. The Fed's FOMC calendar is worth bookmarking.
AI and innovation sentiment. Chip demand, AI capex announcements, product cycles, and the mood around the sector's growth story move the index between scheduled events. Sentiment shifts here can run for weeks — fuel for trends in both directions.
Global risk appetite. As the market's favourite growth index, the Nasdaq-100 rises hardest in risk-on phases and gets sold fastest in risk-off ones. Geopolitics, dollar moves, and shocks elsewhere all feed in.
The common thread is that most of these catalysts are scheduled — Fed meetings, CPI releases, earnings dates. An economic calendar plus an earnings calendar gives you the index's likely volatile days in advance. Plan around them rather than getting blindsided by them.
Since the index itself isn't buyable, you choose an instrument that tracks it. Three realistic routes exist for private traders, plus two honourable mentions.
A Nasdaq CFD (contract for difference) tracks the index's live price. You buy if you expect it to rise, sell if you expect it to fall, and your profit or loss is the difference between your entry and exit — you never own any shares. CFDs trade in flexible sizes, work long or short with equal ease, and use leverage, meaning a margin deposit controls a larger position. That's capital-efficient and equally efficient at magnifying losses, which is why the risk section below isn't optional reading. For retail traders who want to actively trade the index's direction, the nasdaq CFD is the practical instrument — and it's tradable nearly 24 hours on weekdays, not just during the US cash session.
Exchange-traded funds like the Invesco QQQ hold the index's constituents and trade like a share. They suit long-term, buy-and-hold exposure: no leverage by default, no overnight financing, but also no practical short side and only stock-market hours. An investor building wealth over years may prefer the ETF; a trader working session-to-session generally won't.
E-mini and Micro Nasdaq-100 futures on CME Group are the institutional venue — deeply liquid, leveraged, but with fixed contract sizes, expiry dates, and margin mechanics designed for professional-scale trading.
Also out there: options (on the index or on QQQ) for defined-risk strategies with their own steep learning curve, and trading individual Nasdaq stocks — a different game, with single-company risk the index deliberately dilutes.
For most UAE-based retail traders, the honest summary: ETFs for investing, CFDs for trading, futures for professionals.
Here's the quiet advantage of trading US indices from the Gulf: the Nasdaq-100's busiest hours land in the UAE evening, after work — no alarm-clock heroics required.
The index is at its most liquid and most volatile while the US cash equity market is open, 09:30–16:00 New York time. In Gulf Standard Time:
Window (GST, summer) | What's happening | Activity level |
|---|---|---|
~12:00–17:30 | US pre-market; Europe open, US futures drifting on news | Moderate |
17:30–18:30 | US cash open — the day's sharpest moves | Highest |
18:30–22:00 | New York morning; data reactions play out | High |
22:00–00:00 | New York afternoon into the close; late momentum | High |
00:00–12:00 | After-hours and Asia; CFD/futures pricing continues, thinner | Low |
In winter, US clocks shift and the cash session runs roughly 18:30–01:00 GST. Major US economic data typically lands at 16:30 GST (summer) — before the open — and Fed decisions around 22:00 GST, so the UAE evening contains essentially every scheduled catalyst that matters.
Two practical notes. The US cash open is the day's most violent stretch — spreads can widen and moves reverse in seconds, so many disciplined traders let the first 15–30 minutes settle before entering. And while Nasdaq CFDs price nearly around the clock, the thin overnight hours can gap on news — another reason stop losses stay attached. The full session-by-session breakdown is in our index trading hours guide.
Ready to put it together? Here's the process from zero to a first trade, UAE edition:
Notice the order: analysis and risk decisions come before the buy or sell click. On an index this fast, that sequencing is the difference between trading and reacting.
Trading the Nasdaq 100 as a CFD lets you trade the direction of America's biggest tech names—Apple, Microsoft, Nvidia, Amazon and the rest—without buying a single share. Here's how it works at Markets.com, where the index is listed as US Tech 100.
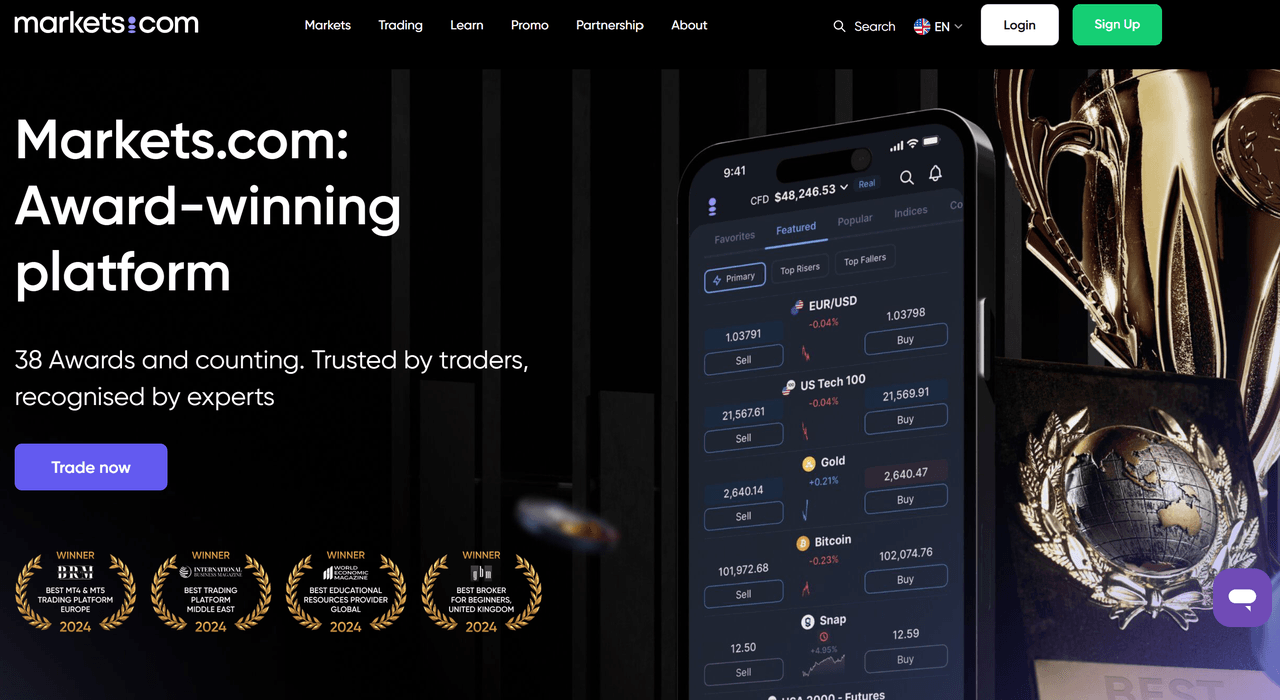
An index tracks a basket of major stocks, so its price reflects how that market is doing overall. With a CFD, you don't own the shares—you speculate on whether the index rises or falls, going long or short either way. And because CFDs are leveraged, a smaller amount of capital controls a larger position, magnifying both gains and losses.
Step 1: Open an Account
Visit Markets.com, and sign up with your email or a Google, Facebook, or Apple account.

Step 2: Verify Your Identity
Complete the KYC check: enter your country, personal details, and a few risk-assessment answers, then upload your proof of ID.
Tip: While your ID is under review, open the demo account to see how index prices move and test a strategy risk-free.
Step 3: Fund Your Account
Deposit via card, bank transfer, e-wallet, Apple Pay, or Google Pay. Only fund what you're prepared to risk—leverage cuts both ways.

Step 4: Choose an Index and Trade
Pick your index—US 500 (S&P 500), US Tech 100 (Nasdaq 100), or Germany 40 (DAX). Set your position size and choose Buy (long) or Sell (short).

Step 5: Manage Your Risk
Set a stop-loss and take-profit before you enter, and watch the economic calendar—index prices react sharply to rate decisions, inflation data, and earnings.
The Nasdaq-100's event-driven volatility supports every major index approach; the same four families from our index trading strategies guide apply here with a tech flavour.
Trend-following suits the index's famous habit of running — sentiment cycles around rates and AI can push it directionally for weeks, and trend traders ride the move with trailing stops. Breakout trading targets the moments the index escapes a consolidation, most often at the US open or straight after data. Range trading works the quieter stretches between catalysts, though ranges on this index tend to be shorter-lived than on the S&P 500. News trading builds the plan around scheduled events — Fed decisions, CPI, mega-cap earnings — with one honest warning: the moment of release brings wide spreads and slippage, so many experienced traders prefer the cleaner move that follows the spike.
Whichever style fits you, risk management does the heavy lifting, because this index punishes casual leverage harder than any other major benchmark:
Consider Omar, an engineer in Abu Dhabi who trades two evenings a week. He shortlists the week's catalysts on Sunday, trades only pre-planned setups after the 17:30 open, risks 1% per trade, and shuts the platform by 22:00. Some weeks he doesn't trade at all — and that selectivity, not a secret indicator, keeps his account intact through the index's rough patches.
Ready to test a strategy? Open a free demo account, trade the US Tech 100 through a few US sessions with virtual funds, then explore indices CFD trading live when your plan — and your risk rules — hold up under practice.
Learning how to trade the Nasdaq 100 comes down to respecting what the index is: a concentrated, rate-sensitive basket of the world's biggest tech companies that moves further and faster than broader benchmarks — the reason it ranked among the most actively traded instruments of 2025, and the reason it demands real discipline. For UAE traders the fit is unusually convenient: the index's busiest hours run through the Gulf evening, and CFDs let you trade its price long or short without owning a single share. Start on a demo, learn its rhythm across a few US sessions, and let your risk rules — not the leverage — set the pace.
The Nasdaq-100 tracks the 100 largest non-financial companies on the Nasdaq exchange; the Nasdaq Composite tracks thousands of listed companies of all sizes. Traders almost always trade the Nasdaq-100, since the liquid CFDs, futures, and ETFs are built on it — the Composite is mainly a news benchmark.
Open an account with a regulated CFD broker available to UAE residents, find the index listed as US Tech 100, and trade its price long or short with a stop loss attached. The most active hours run roughly 17:30–00:00 GST in summer, when the US market is open.
It combines deep liquidity with higher volatility than broader indices, thanks to its concentration in mega-cap tech and sensitivity to interest rates and AI sentiment. Capital.com's 2025 review ranked it among the most actively traded benchmarks in the world for exactly that combination.
Effectively yes. "Nasdaq-100" is the official index name, while CFD platforms typically list the tradable market as US Tech 100 (or NAS100/USTEC) [VERIFY product name]. Both refer to the same underlying index of 100 Nasdaq non-financial companies.
The US cash session opens at 17:30 GST during US summer time and 18:30 GST in winter, closing at midnight and 01:00 respectively. Nasdaq CFDs price nearly 24 hours on weekdays, but liquidity and volatility peak while the US market is open.
Yes — it's typically the most volatile of the major US indices, and CFD leverage magnifies losses as well as gains. Risk is manageable with small position sizes, a stop loss on every trade, and awareness of scheduled events like Fed decisions and mega-cap earnings, but it can't be eliminated.
Capital.com, 2025 trading review — Nasdaq-100 among the most actively traded benchmarks — https://capital.com/en-ae/press/capital-com-reports-strong-2025-growth
Nasdaq, Nasdaq-100 Index overview and methodology — https://www.nasdaq.com/solutions/global-indexes/nasdaq-100
Invesco, QQQ ETF (tracks the Nasdaq-100) — https://www.invesco.com/qqq-etf/en/home.html
CME Group, E-mini Nasdaq-100 futures — https://www.cmegroup.com/markets/equities/nasdaq/e-mini-nasdaq-100.html
Federal Reserve, FOMC meeting calendar — https://www.federalreserve.gov/monetarypolicy/fomccalendars.htm
Risk Warning: This article is provided for informational purposes only and does not constitute investment advice, investment research, or a recommendation to trade. The views expressed are those of the author and do not necessarily reflect the position of Markets.com. When considering shares, indices, forex (foreign exchange), and commodities for trading and price predictions, remember that trading CFDs involves a significant degree of risk and may not be suitable for all investors. Leveraged products can result in capital loss. Past performance is not indicative of future results. Before trading, ensure you fully understand the risks involved and consider your investment objectives and level of experience. Cryptocurrency CFD trading restrictions may apply depending on jurisdiction.
Latest
View all
Wednesday, 9 September 2026
32 min

Wednesday, 9 September 2026
34 min

Tuesday, 8 September 2026
38 min


 EN
EN





