Access Restricted for EU Residents
You are attempting to access a website operated by an entity not regulated in the EU. Products and services on this website do not comply with EU laws or ESMA investor-protection standards.
As an EU resident, you cannot proceed to the offshore website.
Please continue on the EU-regulated website to ensure full regulatory protection.
Thursday Nov 6 2025 09:04

7 min

TOP 12 Candlestick Patterns: Japanese candlestick charts are one of the most popular methods for visualizing price movements in financial markets.
Their unique visual style and ability to convey market sentiment quickly have made them a favored tool among traders and market watchers. This article explores the fundamentals of Japanese candlestick patterns, how to read them, the top patterns to recognize, and their limitations.
Japanese candlestick patterns originated centuries ago and have become a cornerstone in charting price action. Each candlestick represents a specific time period and provides four key pieces of information: the opening price, closing price, high, and low within that period.
The body of the candlestick shows the difference between the open and close prices. If the close is higher than the open, the body is typically hollow or colored to indicate upward movement. Conversely, if the close is lower, the body is filled or colored differently to show downward movement. The lines extending above and below the body, called wicks or shadows, represent the highest and lowest prices reached.
Patterns formed by one or more candlesticks are believed to signal potential future price movements, reflecting shifts in market psychology.
Reading candlestick charts involves understanding both individual candlesticks and the patterns they form over time. Each candlestick tells a story about buyer and seller behavior during the period it represents.
Interpreting these shapes in context with surrounding candlesticks helps to identify potential turning points or continuation trends. The color and size of the bodies, the length of the wicks, and the position relative to previous candles all contribute to the overall picture.

Modern trading platforms and charting tools offer interactive Japanese candlestick charts that can be customized for different time frames—from minutes to months. Using these tools effectively requires:
Selecting the appropriate timeframe for your trading or analysis style.
Observing candlestick formations in conjunction with volume and other market data.
Utilizing zoom and scroll functions to analyze patterns in detail.
Comparing current price action with historical patterns to recognize repetition.
Many platforms also provide pattern recognition features that highlight common candlestick formations automatically, assisting users in spotting potential market signals quickly.
Recognizing key candlestick patterns is essential for interpreting market behavior. Here are twelve widely recognized patterns:
1. Hammer
A candle with a small body near the top and a long lower wick. It often signals a potential reversal after a downtrend, showing buyers began to push prices higher after sellers dominated earlier.
2. Inverted Hammer
Looks like a hammer but with a long upper wick and a small body near the bottom. It can indicate a possible reversal following a downtrend, suggesting buying pressure despite initial selling.

3. Doji
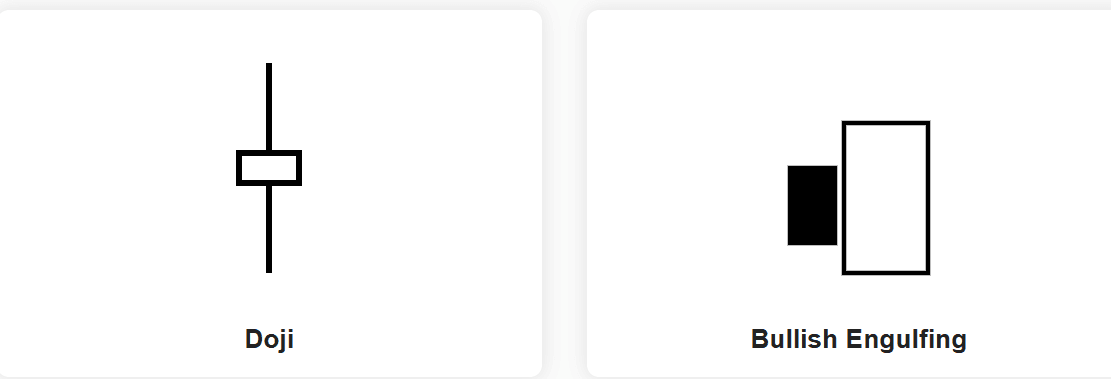
A candle where the open and close are almost equal, forming a cross or plus sign. It reflects indecision among market participants and often precedes a trend change.
4. Bullish Engulfing
A smaller bearish candle followed by a larger bullish candle that completely engulfs the previous body. This pattern suggests a shift in momentum to the upside.

5. Bearish Engulfing
The opposite of the bullish engulfing, this pattern occurs when a smaller bullish candle is followed by a larger bearish candle engulfing it, indicating potential downward movement.
6. Morning Star
A three-candle pattern indicating a possible bullish reversal. It starts with a bearish candle, followed by a small-bodied candle (often a Doji), and then a strong bullish candle.

7. Evening Star
The bearish counterpart to the Morning Star, this pattern signals potential reversal after an uptrend with a bullish candle, a small-bodied candle, and then a bearish candle.
8. Shooting Star
A candle with a small body near the bottom and a long upper wick, often found after an uptrend. It suggests that buyers tried to push prices higher but sellers regained control.

9. Piercing Line
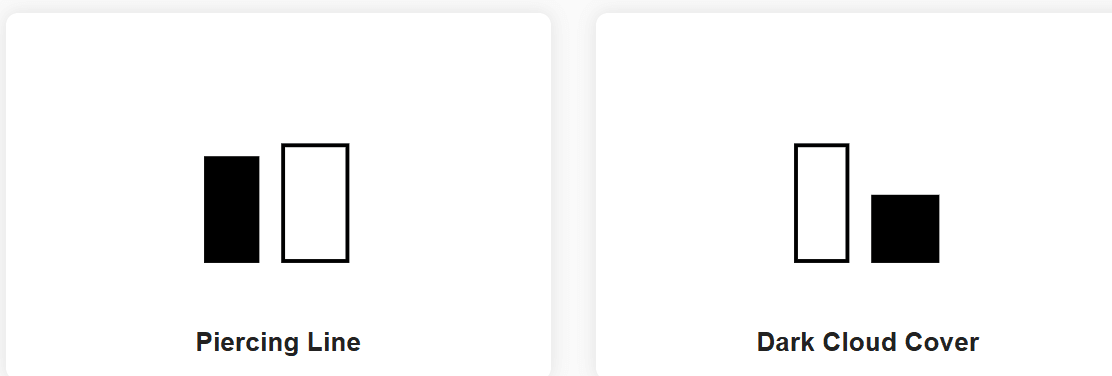
A two-candle pattern where a bearish candle is followed by a bullish candle that closes above the midpoint of the bearish candle’s body. It can be a sign of a bullish reversal.
10. Dark Cloud Cover
Opposite to the piercing line, this pattern features a bullish candle followed by a bearish candle that closes below the midpoint of the bullish candle, indicating a bearish reversal.

11. Three White Soldiers
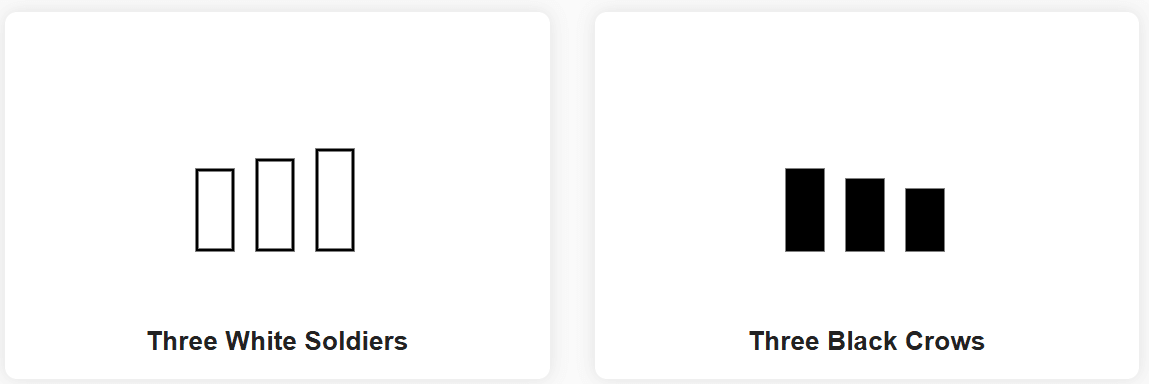
Consists of three consecutive long bullish candles with short wicks, showing steady buying pressure and a strong uptrend.
12. Three Black Crows
Three consecutive long bearish candles indicating persistent selling pressure and a strong downtrend.

While candlestick patterns provide useful insights, they are not foolproof. Some limitations include:
Japanese candlestick patterns offer a visually intuitive way to understand market sentiment and price movements. Learning to identify and interpret the top candlestick formations can enhance awareness of potential trend reversals and continuations.
However, candlestick patterns should be approached as part of a broader toolkit rather than relied on exclusively. Recognizing their limitations and combining them with other methods can provide a more comprehensive view of market behavior.
Mastering candlestick charts takes practice and attention to detail, but their rich history and widespread use underscore their enduring value in the world of price charting.
Risk Warning: this article represents only the author’s views and is for reference only. It does not constitute investment advice or financial guidance, nor does it represent the stance of the Markets.com platform.When considering shares, indices, forex (foreign exchange) and commodities for trading and price predictions, remember that trading CFDs involves a significant degree of risk and could result in capital loss.Past performance is not indicative of any future results. This information is provided for informative purposes only and should not be construed to be investment advice. Trading cryptocurrency CFDs and spread bets is restricted for all UK retail clients.