Access Restricted for EU Residents
You are attempting to access a website operated by an entity not regulated in the EU. Products and services on this website do not comply with EU laws or ESMA investor-protection standards.
As an EU resident, you cannot proceed to the offshore website.
Please continue on the EU-regulated website to ensure full regulatory protection.
Tuesday Oct 28 2025 07:08

6 min

Trading strategies with examples: In the world of trading, certain patterns and signals help market participants interpret price movements and potential trend changes.
Among these, the concepts of the Golden Cross and Death Cross stand out as widely recognized indicators derived from moving averages. This article explores the meaning behind these terms, how they are applied using various tools, and what traders should consider when utilizing them.
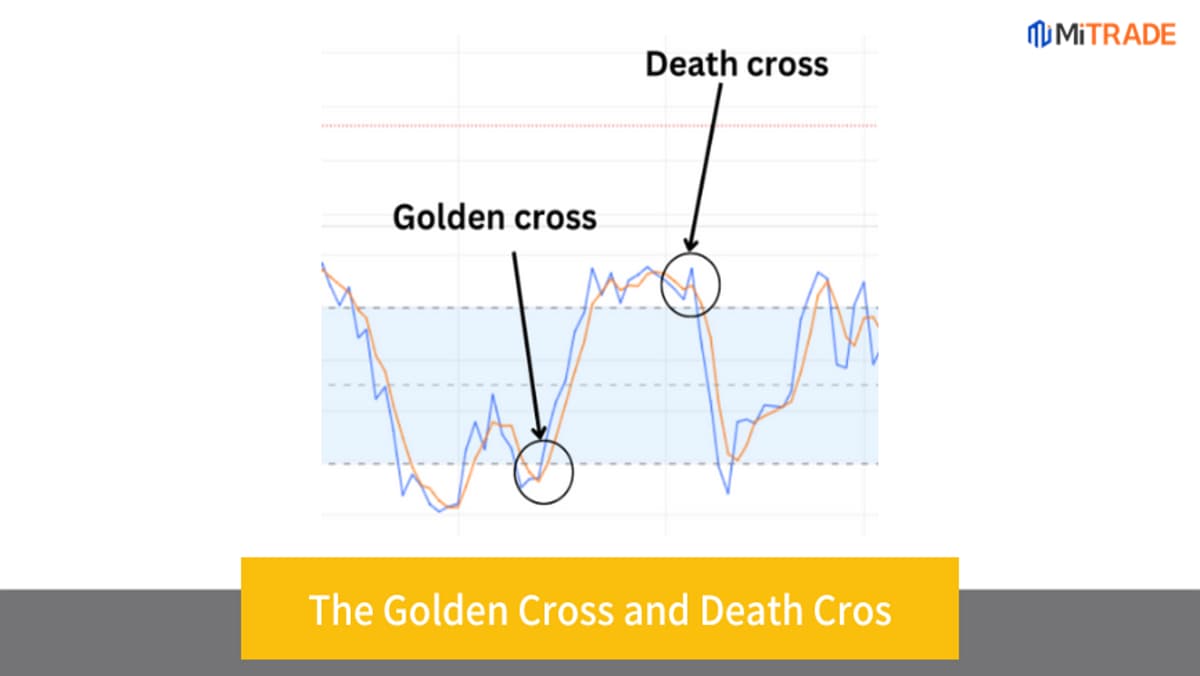
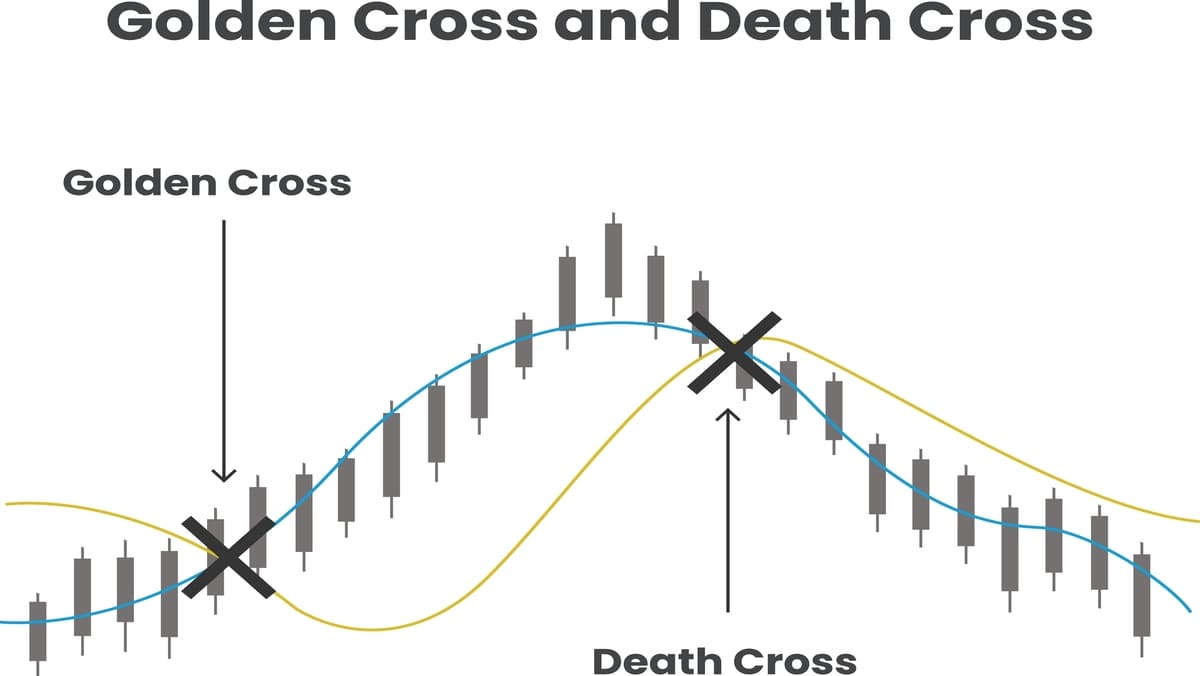
The Golden Cross and Death Cross are terms used to describe specific crossover events between different moving averages on a price chart.
The Golden Cross occurs when a shorter-term moving average crosses above a longer-term moving average, often seen as a signal that a rising trend may be underway.
The Death Cross happens when a shorter-term moving average crosses below a longer-term moving average, typically interpreted as a sign that a downward trend could be starting.
These crossover points are used by traders to identify potential shifts in momentum and adjust their strategies accordingly.
Moving averages are smoothing tools that help reduce noise from price fluctuations by averaging prices over a defined period. Common moving averages include the 50-day and 200-day averages.

When the 50-day moving average crosses above the 200-day moving average, this is the classic Golden Cross. It implies that recent prices are gaining strength relative to longer-term prices.
Conversely, when the 50-day moving average crosses below the 200-day moving average, the Death Cross is formed, suggesting weakening price momentum.
Traders use these signals to anticipate potential trend reversals or confirmations, often combining them with other indicators or market context for confirmation.
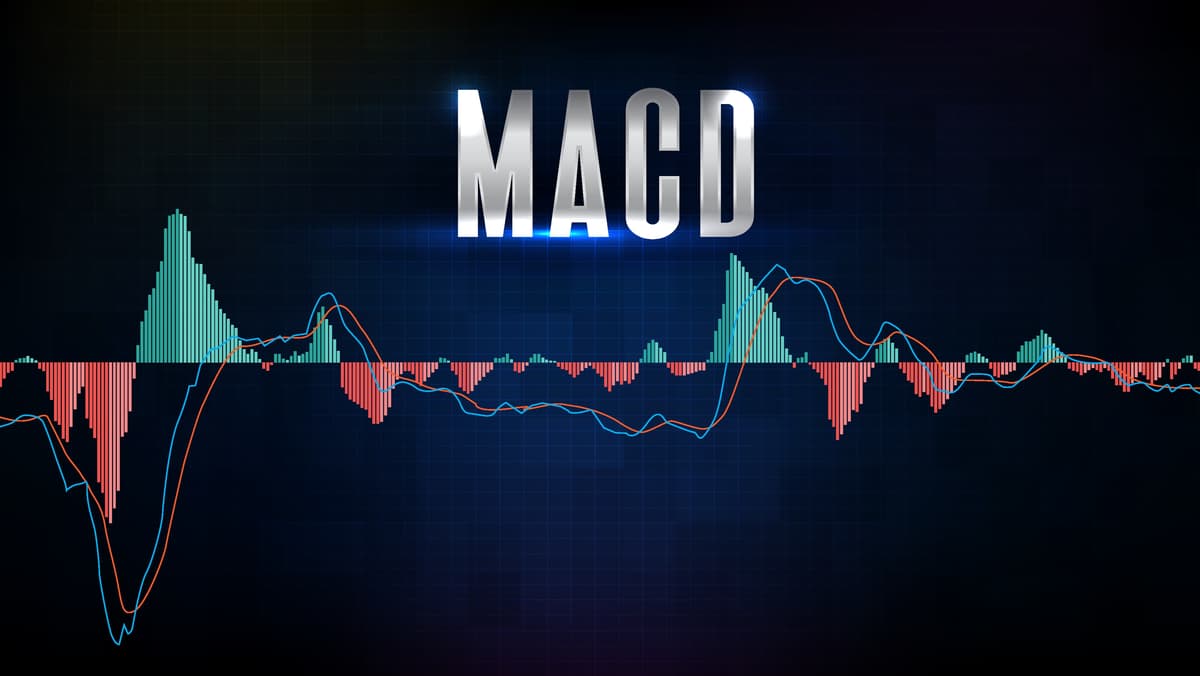
The Moving Average Convergence Divergence (MACD) is a popular momentum indicator that can also reflect crossover behavior akin to Golden and Death Crosses.
In MACD, the crossing of the MACD line above the signal line resembles a Golden Cross, signaling bullish momentum.

The crossing of the MACD line below the signal line resembles a Death Cross, indicating bearish momentum.
Using MACD alongside moving average crossovers can provide a layered view of market momentum, helping traders refine entry and exit points.
The KD indicator, or stochastic oscillator, tracks momentum by comparing closing prices to a recent price range.
A crossover of the %K line above the %D line can be seen as a Golden Cross equivalent, suggesting upward momentum.
A crossover of the %K line below the %D line is similar to a Death Cross, pointing towards downward momentum.
While the KD indicator focuses on momentum rather than price averages, its crossover signals provide complementary insights to moving average crossovers.
Crossing indicators like the Golden Cross and Death Cross help simplify complex price movements into actionable signals. They filter out short-term volatility and highlight potential trend changes by focusing on the relationship between different timeframes.
Using crossing indicators allows traders to:
Develop systematic approaches to entering or exiting trades based on defined criteria.
These indicators act as guides rather than guarantees, reducing uncertainty in decision-making.

While Golden and Death Crosses are valuable tools, there are several important considerations:
Risk Management: Using stop-loss levels and position sizing remains critical, regardless of signal type.
Understanding these aspects helps traders use crossovers as part of a broader toolkit rather than relying solely on them.
The Golden Cross and Death Cross remain foundational concepts in trading, offering a straightforward way to interpret potential trend changes. By crossing moving averages or momentum lines, these signals help highlight shifts in market direction.
When combined with other indicators like MACD or stochastic oscillators, they provide a richer understanding of price dynamics. However, awareness of their limitations and the market environment is essential to avoid pitfalls.
Using crossing indicators thoughtfully and in combination with other tools can enhance trading strategies and improve timing decisions. They serve as valuable guides for navigating the complexities of market movements.
Risk Warning: this article represents only the author’s views and is for reference only. It does not constitute investment advice or financial guidance, nor does it represent the stance of the Markets.com platform.When considering shares, indices, forex (foreign exchange) and commodities for trading and price predictions, remember that trading CFDs involves a significant degree of risk and could result in capital loss.Past performance is not indicative of any future results. This information is provided for informative purposes only and should not be construed to be investment advice. Trading cryptocurrency CFDs and spread bets is restricted for all UK retail clients.