Wednesday Jun 10 2020 10:30

3 min
Yesterday’s API oil inventories report showed a massive build, even though a draw had been expected. Forecasts for today’s US EIA crude oil inventories also predict a drop – how accurate are these predictions?
Yesterday’s crude oil stock change report from the American Petroleum Institute was expected to show that inventories fell by 1.7 million barrels in the week ending June 5th. Instead, stocks rose nearly 8.5 million barrels.
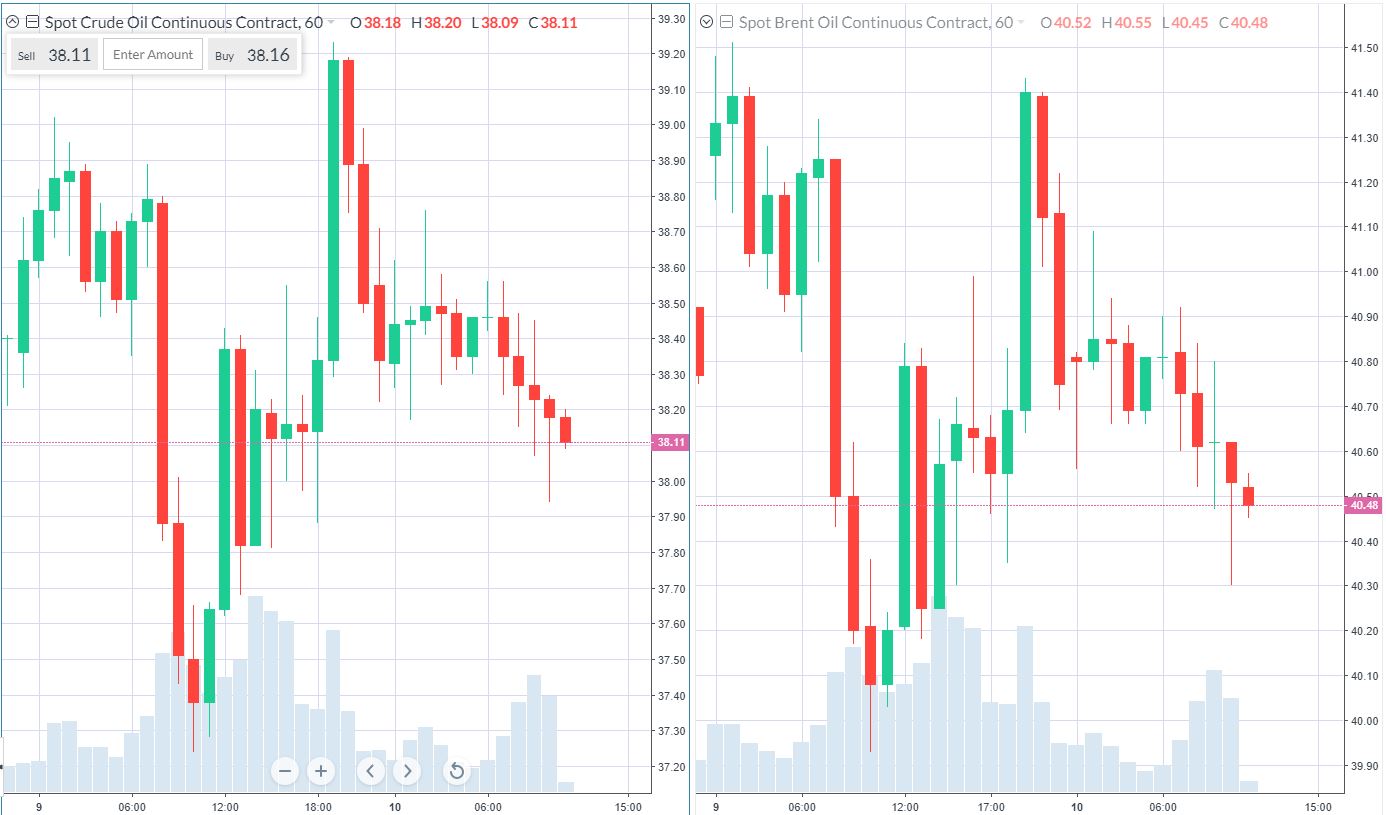
Oil fell further from the three-month highs hit on Monday on the back of the data. Today crude oil is currently down -$0.38 to trade around $38.12, while Brent oil is trending at $40.46 after falling -$0.29. This is partly due to the API data, but also because of expectations OPEC will not extend the record level of production cuts beyond July.

The Energy Information Administration releases its official crude oil inventories report later today. Forecasts were for a draw of over two million barrels, although in light of the API data this seems unlikely.
In fact, over the past five weeks forecasts for EIA data have been significantly wrong. On average, the forecast has been out by around 5 million barrels. In the past four weeks, forecasters have got the direction of inventory stocks wrong, predicting a build when in fact stocks fell, or vice versa.
|
Release Date |
Actual |
Forecast |
Difference |
|
Jun 03, 2020 |
-2.077M | 3.038M |
5.115M |
|
May 28, 2020 |
7.928M | -1.944M |
9.872M |
|
May 20, 2020 |
-4.983M | 1.151M |
6.134M |
|
May 13, 2020 |
-0.745M | 4.147M |
4.892M |
| May 06, 2020 |
4.590M |
7.759M |
3.169M |
Meanwhile, for the past three weeks, the API data and the EIA crude oil inventories report have both shown stockpiles moving in the same direction.
For the week commencing May 25th, the API data showed a build of 8.7 million barrels – under a million barrels above the EIA print.
For the week beginning May 18th, the API numbers were just 183,000 barrels below the EIA’s reported draw of -4.983 million.
Risk Warning: this article represents only the author’s views and is for reference only. It does not constitute investment advice or financial guidance, nor does it represent the stance of the Markets.com platform.When considering shares, indices, forex (foreign exchange) and commodities for trading and price predictions, remember that trading CFDs involves a significant degree of risk and could result in capital loss.Past performance is not indicative of any future results. This information is provided for informative purposes only and should not be construed to be investment advice. Trading cryptocurrency CFDs and spread bets is restricted for all UK retail clients.