Tuesday Aug 19 2025 06:18

5 min

The Canadian dollar held steady against the U.S. dollar on Monday, supported by higher oil prices while investors awaited key inflation data. Canada’s July consumer price index (CPI) report, due today at 1230 GMT, is expected to show headline inflation easing slightly to 1.8% from 1.9% in June. However, core measures closely watched by the Bank of Canada (BoC), the trim and median CPI are projected to remain near 3%, well above the 2% target, as tariffs and resilient consumer spending keep price pressures elevated.
Moreover, market participants currently assign a 68% probability that the BoC will hold interest rates steady at 2.75% during its next policy meeting on September 17. The central bank has kept rates unchanged since cutting them in March, with the latest inflation data likely to shape expectations for its policy outlook.

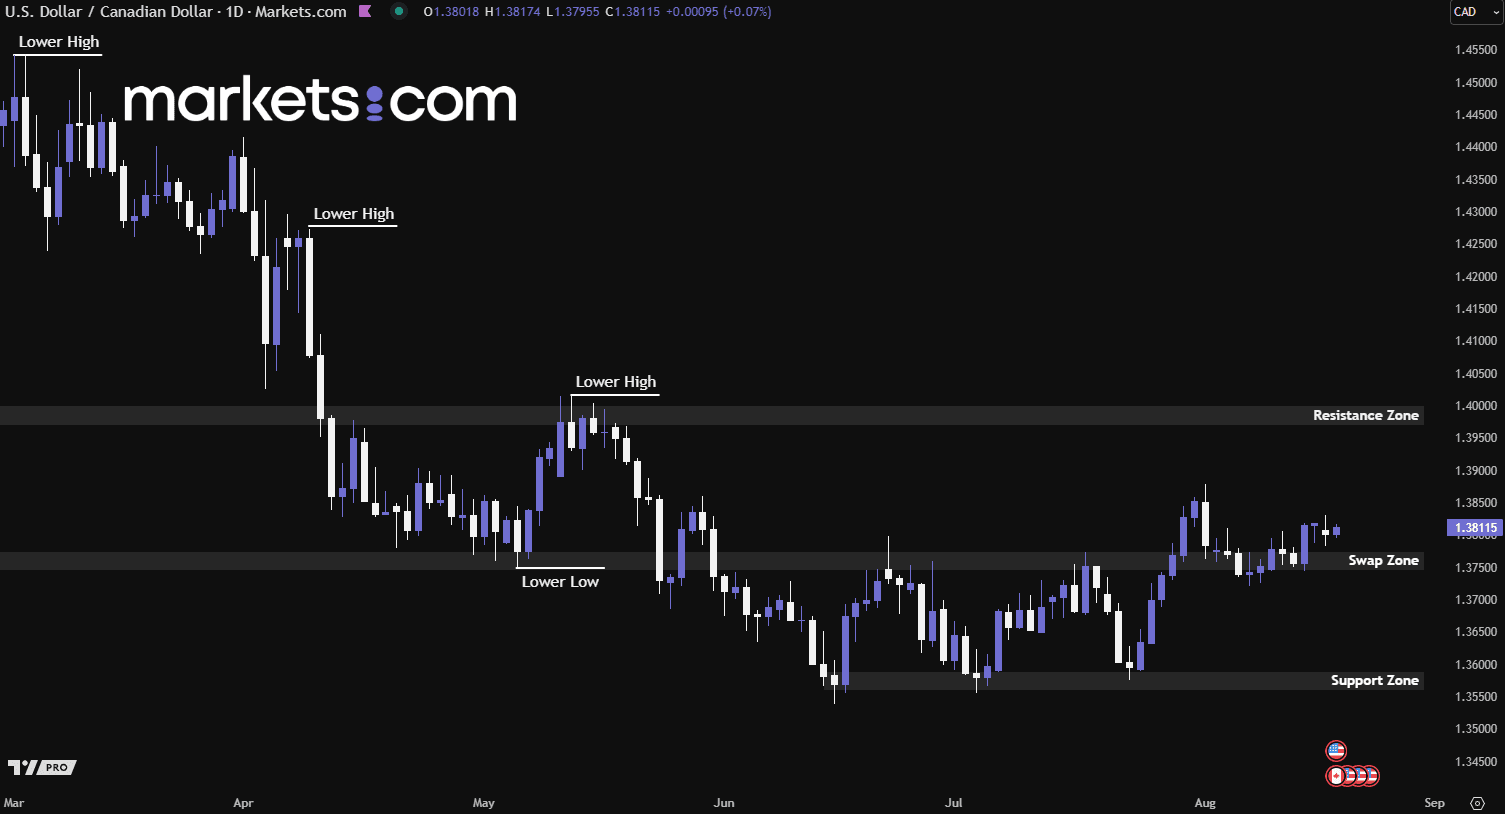
(USD/CAD Daily Chart, Source: Trading View)
From a technical analysis perspective, the USD/CAD currency pair has been moving in a bullish trend since mid-June 2025, after retesting the support zone of 1.3560 – 1.3590 and surging upward, as indicated by the formation of higher highs and higher lows. Recently, the pair broke above the swap zone of 1.3745 – 1.3775, pulled back to retest it, found support, and continued to climb. This valid bullish structure suggests the potential for further upside movement.
The U.S. dollar strengthened on Monday as President Donald Trump hosted high-level talks aimed at ending Russia’s war in Ukraine. At the same time, traders reduced bets on a September rate cut ahead of Federal Reserve Chair Jerome Powell’s speech at Jackson Hole on Friday. Trump met Ukrainian President Volodymyr Zelenskiy and later conferred with leaders from Britain, Germany, France, Italy, Finland, the EU, and NATO. He pledged U.S. support for European security in any peace deal. He voiced optimism the summit could pave the way for a trilateral meeting with Russian President Vladimir Putin, adding he believes Putin wants the war to end.
At the same time, markets remain focused on Powell’s remarks for policy clues. The Fed chief has signalled reluctance to cut rates, warning that Trump’s tariff measures could fuel inflation. Bets on a September 16 – 17 cut eased further after July producer prices came in hotter than expected, offsetting earlier speculation sparked by softer consumer price data.

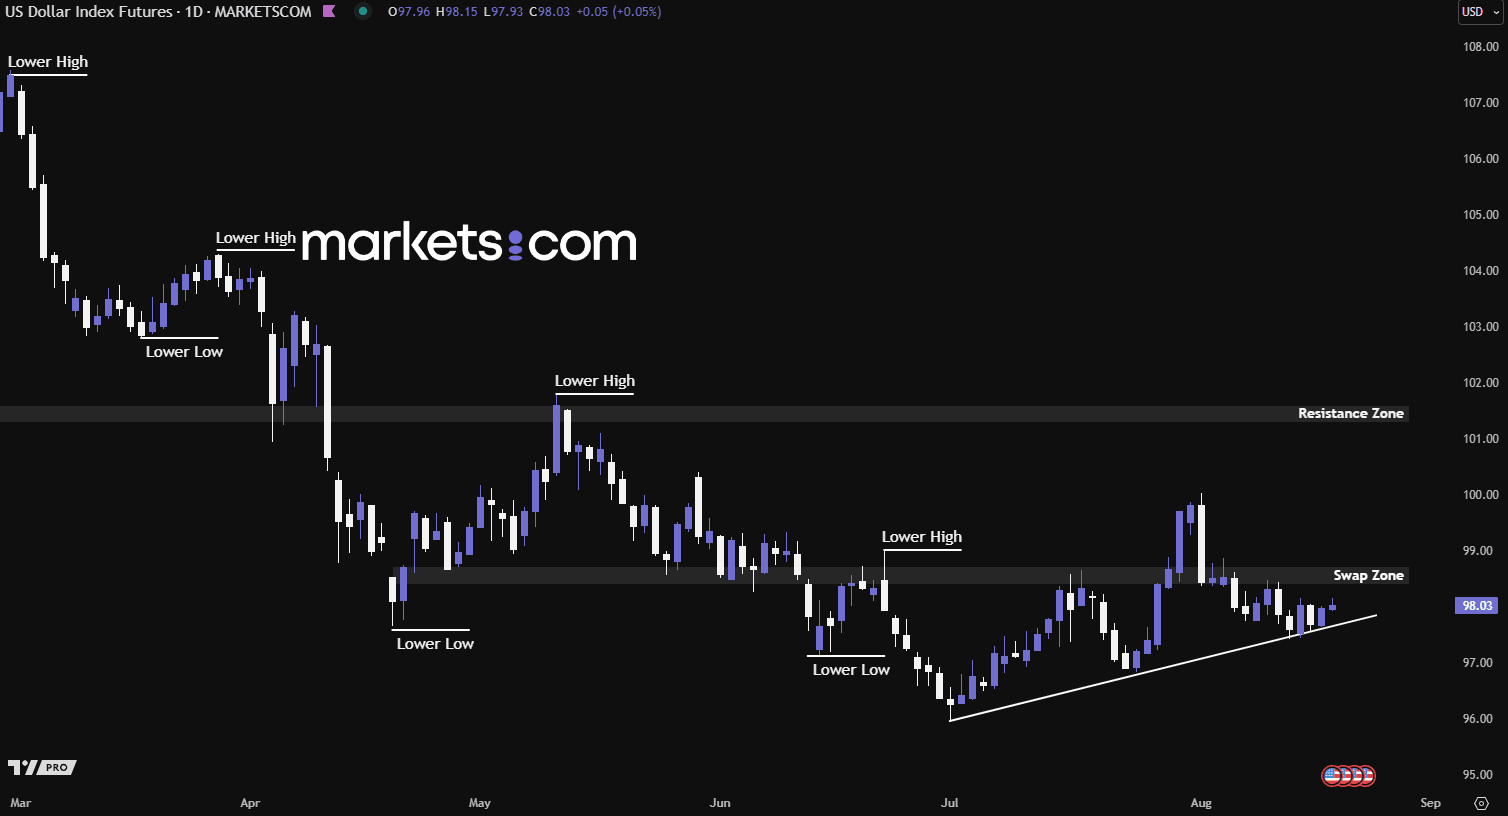
(U.S Dollar Index Daily Chart, Source: Trading View)
From a technical analysis perspective, the U.S. dollar has been in a bearish trend since mid-January 2025, as indicated by the lower highs and lower lows. Recently, it rebounded from the ascending trend line, but this does not necessarily mean the bulls have regained control. For the bulls to reclaim dominance, the index would need to break above the swap zone of 98.40 – 98.70 to continue surging upwards. Therefore, the battle between bears and bulls within this trend line and swap zone is crucial, as it could potentially determine the next directional move.
Japan’s Nikkei 225 hovered near 43,770 during the Asian trading session on Tuesday at the time of writing, pausing after recent record highs. Investors remained cautious amid geopolitical uncertainty, as U.S. President Donald Trump urged Russian President Vladimir Putin to prepare for a summit with Ukrainian President Volodymyr Zelenskiy, the latest step in Trump’s push to end the three-year war.
Market attention is also turning to Federal Reserve Chair Jerome Powell’s upcoming speech at the Jackson Hole symposium, where investors hope for clues on future rate policy. Domestically, Japan’s economy grew faster than expected in Q2, fueled by strong net exports despite U.S. tariff pressures, with trade data ahead set to provide further insight into the outlook.

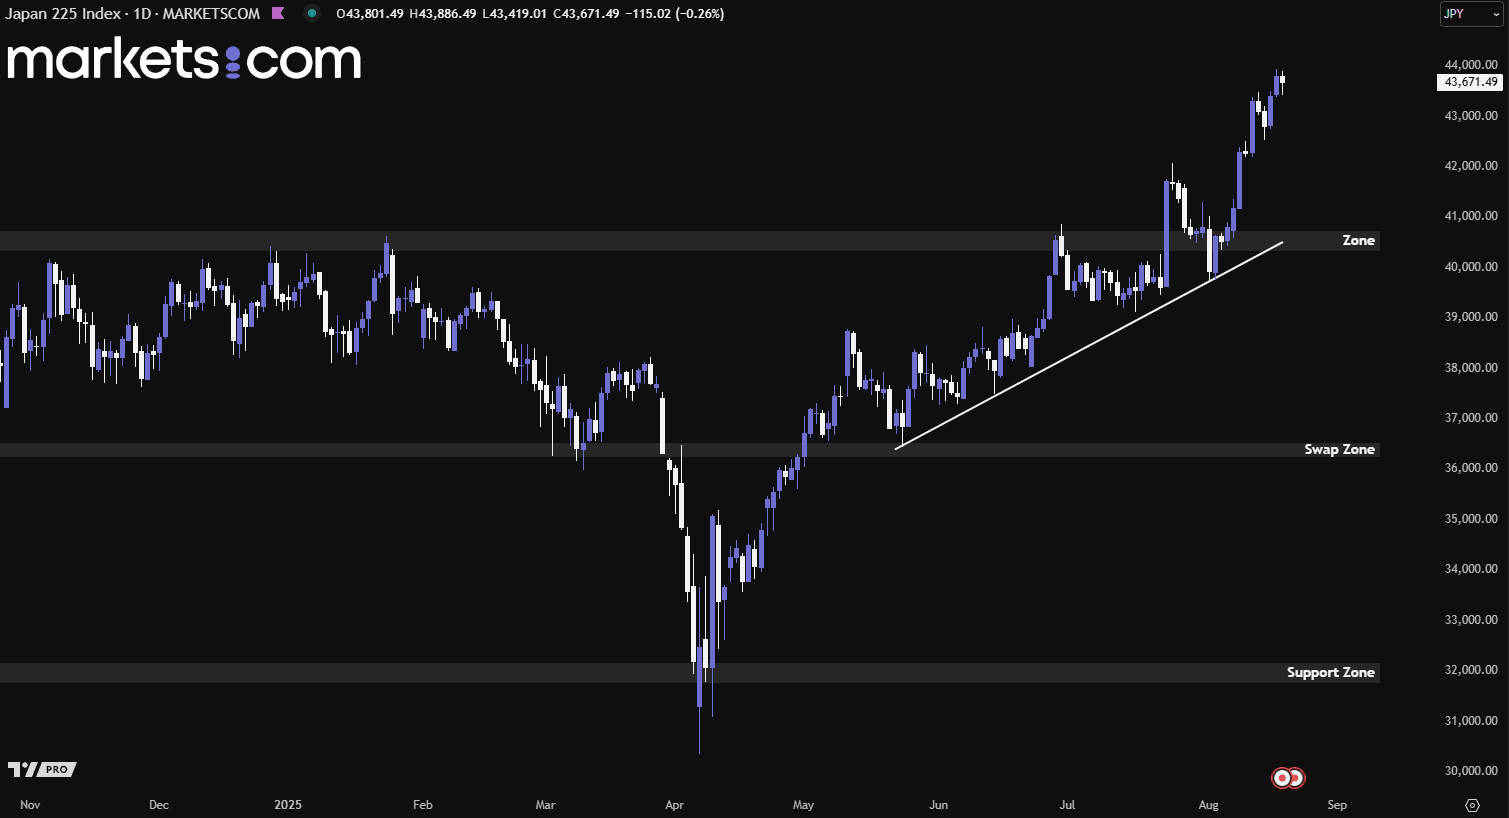
(Japan 225 Index Daily Chart, Source: Trading View)
From a technical analysis perspective, the Japan 225 index broke above the 40,300 – 40,800 zone, pulled back and found support at the ascending trend line, and then continued to surge higher with strong bullish momentum. The consistent pattern of higher highs and higher lows since April 2025 suggests a robust bullish trend, which may continue driving the index upward until a significant bearish reversal pattern emerges.
Risk Warning: this article represents only the author’s views and is for reference only. It does not constitute investment advice or financial guidance, nor does it represent the stance of the Markets.com platform.When considering shares, indices, forex (foreign exchange) and commodities for trading and price predictions, remember that trading CFDs involves a significant degree of risk and could result in capital loss.Past performance is not indicative of any future results. This information is provided for informative purposes only and should not be construed to be investment advice. Trading cryptocurrency CFDs and spread bets is restricted for all UK retail clients.