Thursday May 22 2025 01:52

4 min

UK inflation surged more than expected in April, with several key components closely watched by the Bank of England showing sharp increases. According to data released by the Office for National Statistics, the annual consumer price inflation jumped to 3.5% from 2.6% in March, the highest level since January 2024 and the sharpest monthly acceleration since 2022. The surprise uptick will likely reinforce the Bank of England’s cautious approach to easing, weakening market expectations for more than one rate cut by the end of 2025.
A particularly concerning aspect for policymakers was the spike in services inflation, a key gauge of domestic price pressures. It rose to 5.4% in April, significantly exceeding both the consensus forecast of 4.8% from a Reuters poll and the BoE’s projection of 5.0%. This persistent stickiness in core inflation components may force the central bank to delay or moderate its plans for monetary loosening.

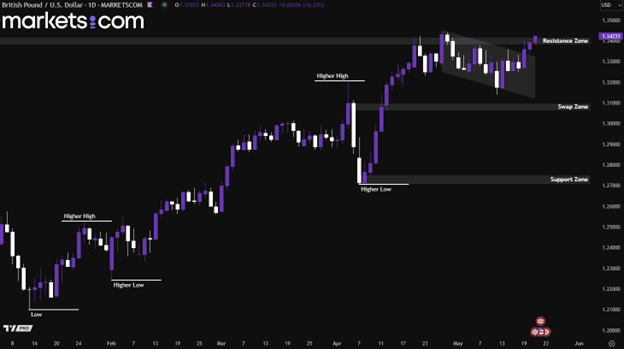
(GBP/USD Daily Chart, Source: Trading View)
From a technical analysis perspective, the GBP/USD currency pair has been in a bullish trend since mid-January 2025, as indicated by the formation of higher highs and higher lows. Recently, it broke above the descending channel and is currently retesting the resistance zone at 1.3380 – 1.3420. If it manages to break above this zone, the pair may potentially surge higher.
Oil prices surged over 1% on Wednesday following reports that Israel may be preparing to launch a strike on Iranian nuclear facilities, heightening fears of potential supply disruptions in the Middle East. According to CNN, U.S. intelligence has indicated that Israel is gearing up for such an attack, although it remains unclear whether a final decision has been made by Israeli leadership.
Iran, the third-largest oil producer within OPEC, plays a significant role in global supply, and any military action could severely impact its oil output. In addition, there are growing concerns that Iran might retaliate by attempting to block the Strait of Hormuz, a critical chokepoint through which major exporters like Saudi Arabia, Kuwait, Iraq, and the UAE ship crude oil and fuel, posing a broader risk to global energy markets.

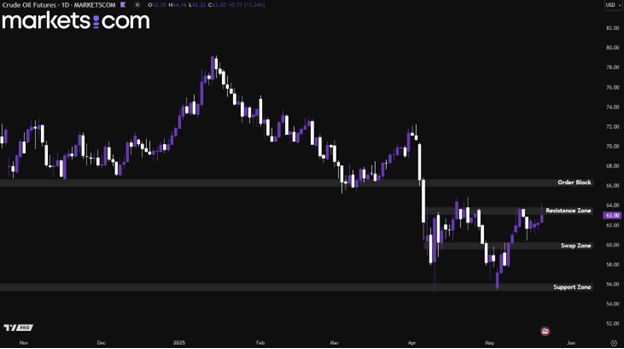
(Crude Oil Futures Daily Chart, Source: Trading View)
From a technical analysis perspective, the crude oil future is currently retesting the resistance zone at 63.10 – 63.80. If the price breaks above this zone, it may potentially surge higher to retest the order block at 66.00 – 66.60. Conversely, if bearish pressure prevents a breakout, it may drop lower to retest the swap zone of 59.50 – 60.20.
Gold is nearing a two-week high after gaining over 2% in the previous session. The rally was driven by rising geopolitical tensions and a continued decline in the US dollar. Reports of Israel potentially planning a strike on Iranian nuclear sites have heightened fears of an escalation in the Middle East conflict, with possible retaliation from Iran adding to market anxiety.
At the same time, U.S. President Trump stated that Russia and Ukraine would soon begin ceasefire talks. However, he indicated he would not be actively involved in mediating the ongoing conflict. The US dollar remained under pressure following the Federal Reserve’s cautious economic outlook and a credit rating downgrade by Moody’s, citing the country's growing debt burden. The weaker dollar has made gold more attractive to international buyers, reinforcing demand and supporting the metal’s upward momentum.

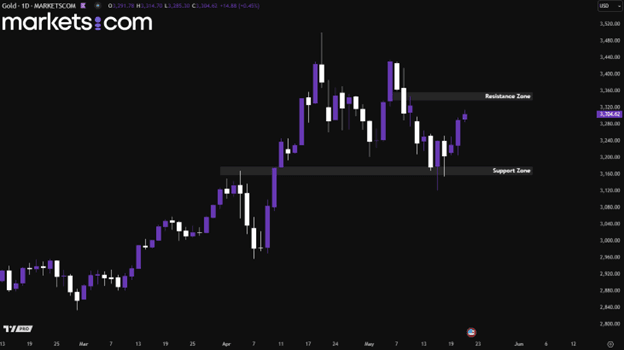
(Gold Price Daily Chart, Source: Trading View)
From a technical analysis perspective, gold has recently found support from the 3,160 –3,180 zone. It can be observed that three candlesticks retested this area and were supported by strong bullish buying pressure, resulting in candlesticks with long lower wicks. Following this, the price has been moving upward with strong bullish momentum. Therefore, it may continue riding this momentum and potentially move higher to retest the resistance zone at 3,340 – 3,360.
Risk Warning: this article represents only the author’s views and is for reference only. It does not constitute investment advice or financial guidance, nor does it represent the stance of the Markets.com platform.When considering shares, indices, forex (foreign exchange) and commodities for trading and price predictions, remember that trading CFDs involves a significant degree of risk and could result in capital loss.Past performance is not indicative of any future results. This information is provided for informative purposes only and should not be construed to be investment advice. Trading cryptocurrency CFDs and spread bets is restricted for all UK retail clients.