Access Restricted for EU Residents
You are attempting to access a website operated by an entity not regulated in the EU. Products and services on this website do not comply with EU laws or ESMA investor-protection standards.
As an EU resident, you cannot proceed to the offshore website.
Please continue on the EU-regulated website to ensure full regulatory protection.
Monday Aug 11 2025 06:36

5 min

Gold prices fell below $3,368 per ounce on Monday as easing geopolitical tensions reduced demand for the metal’s perceived safe-haven appeal. The decline followed U.S. President Donald Trump’s announcement on Friday that he will meet Russian President Vladimir Putin on August 15 in Alaska to negotiate an end to the war in Ukraine, a move that could avert further U.S. sanctions on Moscow.
Losses in gold may be capped by ongoing trade concerns and growing expectations of Federal Reserve rate cuts later this year. Higher U.S. tariffs on imports from multiple countries took effect last Thursday, pressuring trade partners to seek better deals. Investors now await key U.S. economic data releases, including CPI, PPI, and retail sales, later this week for signals on the Fed’s policy path.

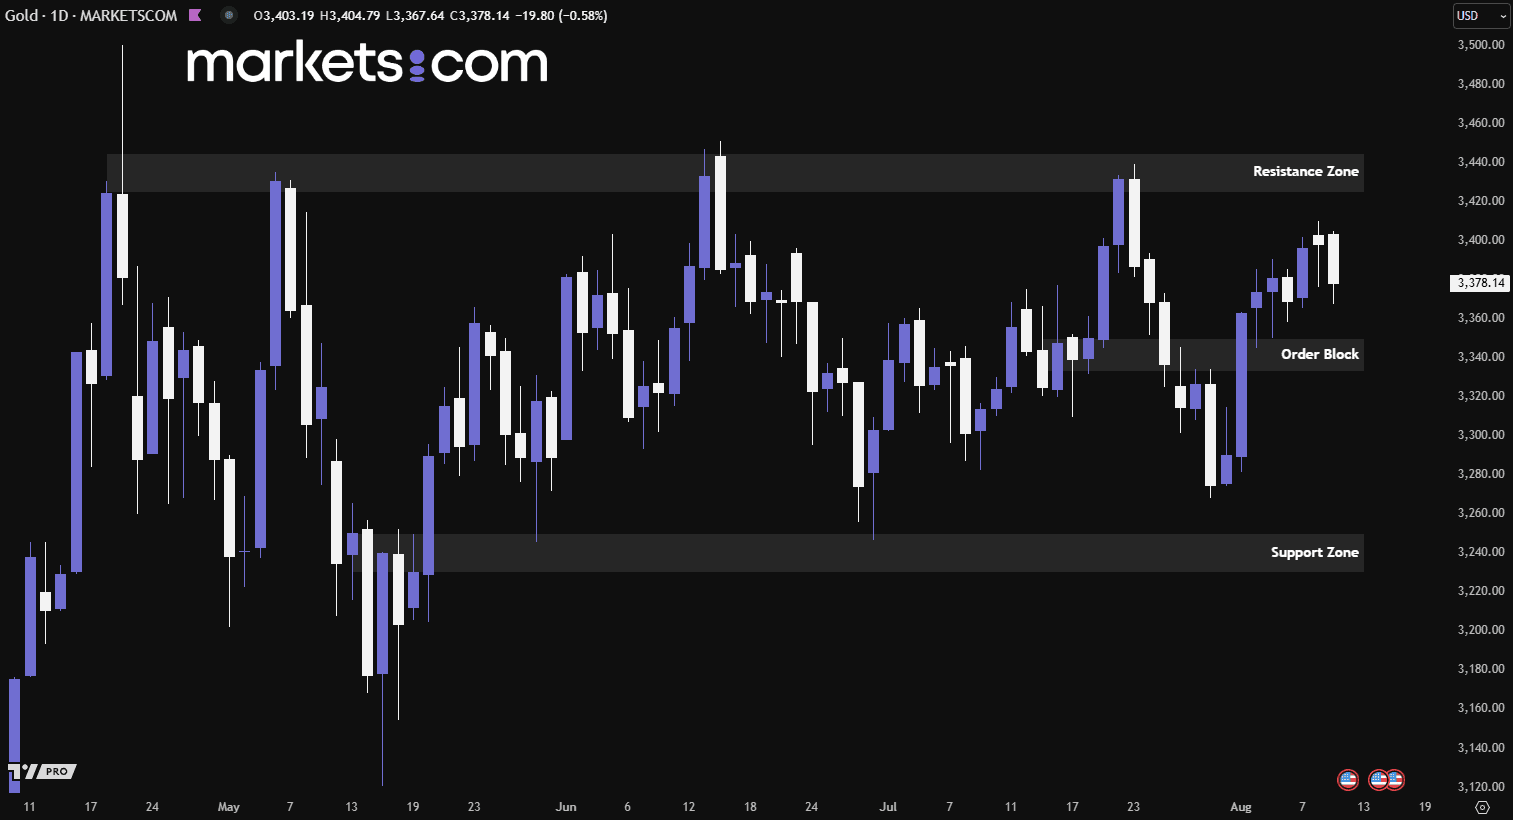
(Gold Daily Price Chart, Source: Trading View)
From a technical analysis perspective, the gold price has been moving in a consolidation phase since late May 2025, as the price can’t break either the resistance zone or support zone. Recently, the price has surged upwards with significant bullish momentum and even broke above the order block of 3,333 – 3,350. This could further give confirmation of the bullish movement, potentially continuing to push the gold price higher.
Wall Street’s three major indexes ended higher on Friday, driven mainly by the “Magnificent 7” tech giants. The Nasdaq Composite (IXIC) notched its second consecutive record close, its 18th this year. The S&P 500 came close to topping its July 28 record but fell short by just 0.16 points, while the Dow Jones Industrial Average (DJI) gained on the day yet remained 1.86% below its December 4 record.
Apple (AAPL) delivered the largest boost to the S&P 500, continuing to benefit from Wednesday’s announcement of a $100 billion U.S. investment, which could help the company avoid tariffs on iPhones. Investor sentiment was also buoyed by growing expectations of a more dovish Federal Reserve, alongside a brighter outlook for the upcoming earnings season in the first full trading week of August.

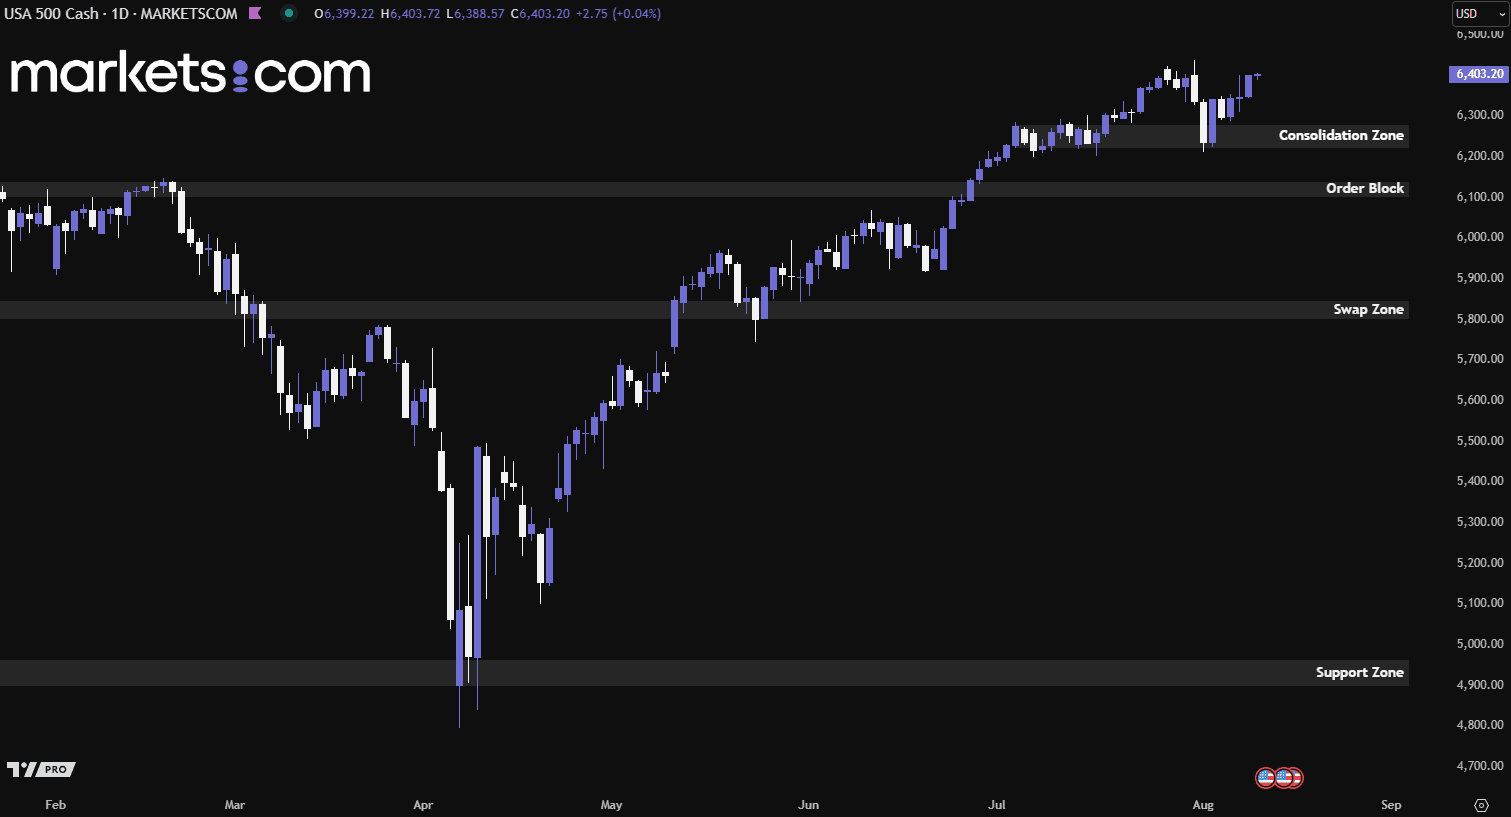
(S&P 500 Index Daily Chart, Source: Trading View)
From a technical analysis perspective, the S&P 500 index has been in a bullish trend since April 2025, as evidenced by a series of higher highs and higher lows. Recently, it broke above the consolidation zone of 6,220 – 6,280 with strong bullish momentum, but has since pulled back and is currently retesting that zone. However, it then found support from the consolidation zone, gained bullish momentum and continued to surge upwards. Such a valid bullish movement could potentially continue to push the index higher.
U.S. Treasury Secretary Scott Bessent said the next Federal Reserve chair should be someone capable of evaluating the entire organisation, as the Fed’s expanding role beyond monetary policy has risked its independence. Speaking to the Nikkei in Washington on August 7, Bessent stressed the importance of having a leader who commands market confidence, can interpret complex economic data, and prioritises forward-looking analysis over reliance on historical trends.
On exchange rates, Bessent clarified that his administration’s definition of a strong dollar is based not on its market price alone but on its relative value against other currencies. He emphasised that sound economic policies will naturally keep the U.S. dollar strong as the world’s reserve currency. Bessent, who has led discussions with Japan on currency matters, noted that during a May meeting with Japanese Finance Minister Katsunobu Kato on the sidelines of the G7, both sides agreed the dollar-yen rate at the time reflected economic fundamentals.

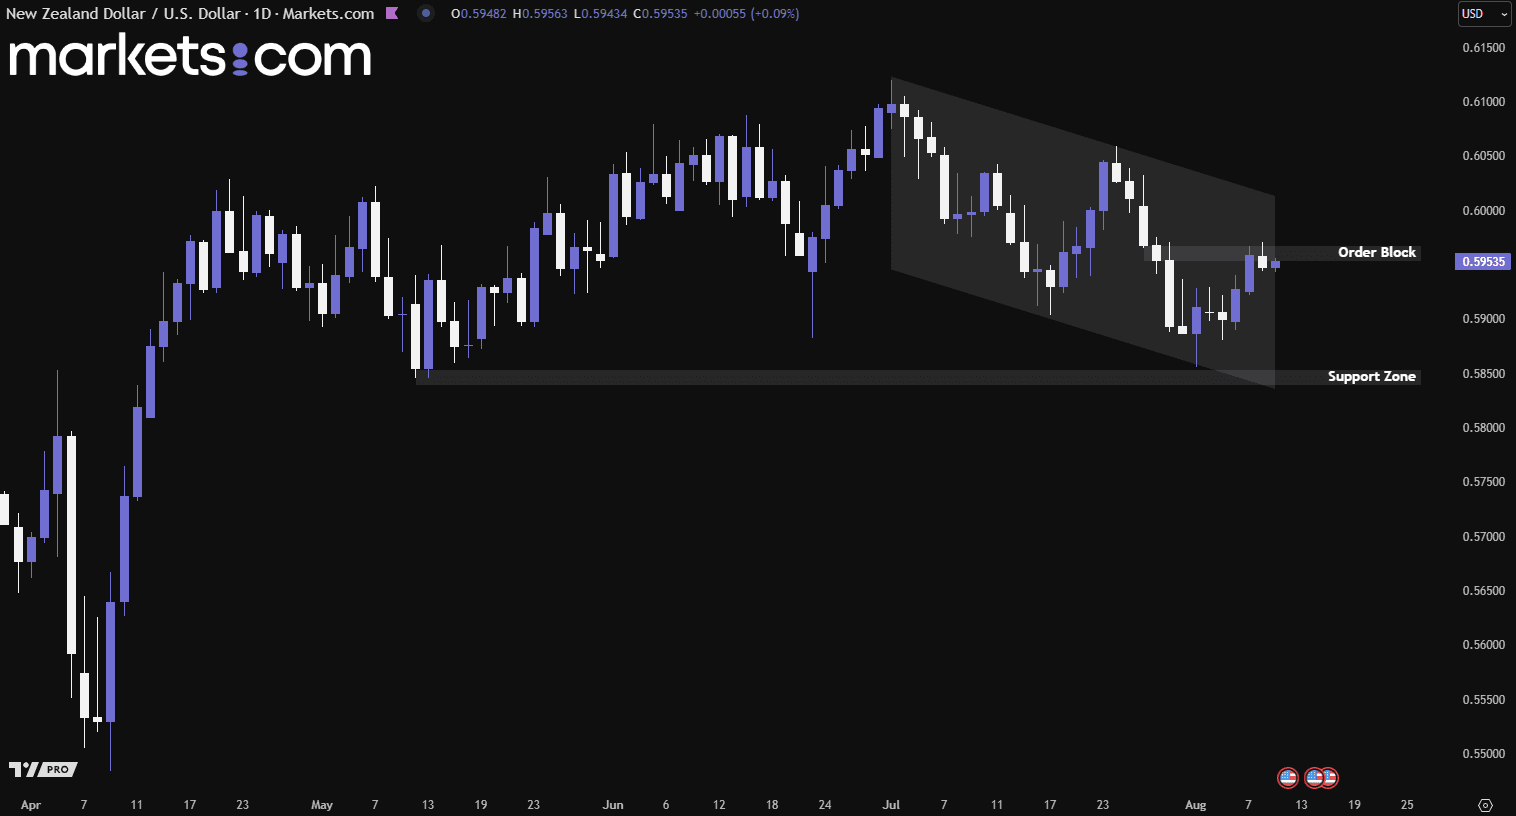
(NZD/USD Daily Chart, Source: Trading View)
From a technical analysis perspective, the NZD/USD currency pair has been moving in a bearish trend since early July 2025, as indicated by the lower highs and lower lows within the descending channel. The pair has rebounded from the lower boundary of the channel and is retesting at the order block of 0.5955 – 0.5970 currently. If it can break above this zone, it may potentially continue to move higher and retest the upper boundary of the descending channel. Conversely, if the bearish force prevents a breakout above this zone, it may potentially drop lower to retest the support zone of 0.5840 – 0.5855.
Risk Warning and Disclaimer: This article represents only the author’s views and is for reference only. It does not constitute investment advice or financial guidance, nor does it represent the stance of the Markets.com platform. Trading Contracts for Difference (CFDs) involves high leverage and significant risks. Before making any trading decisions, we recommend consulting a professional financial advisor to assess your financial situation and risk tolerance. Any trading decisions based on this article are at your own risk.