Friday Feb 21 2025 10:11

4 min

Oil prices rose consecutively for the past four days, mainly driven by declining U.S. gasoline and distillates inventories, which heightened expectations for strong demand. Additionally, worries about supply disruptions in Russia provided further support. Furthermore, hopes for a possible peace agreement between Russia and Ukraine, which might lead to eased sanctions on Moscow, have diminished somewhat due to Ukraine's firmer position, leading some investors to re-enter the market.

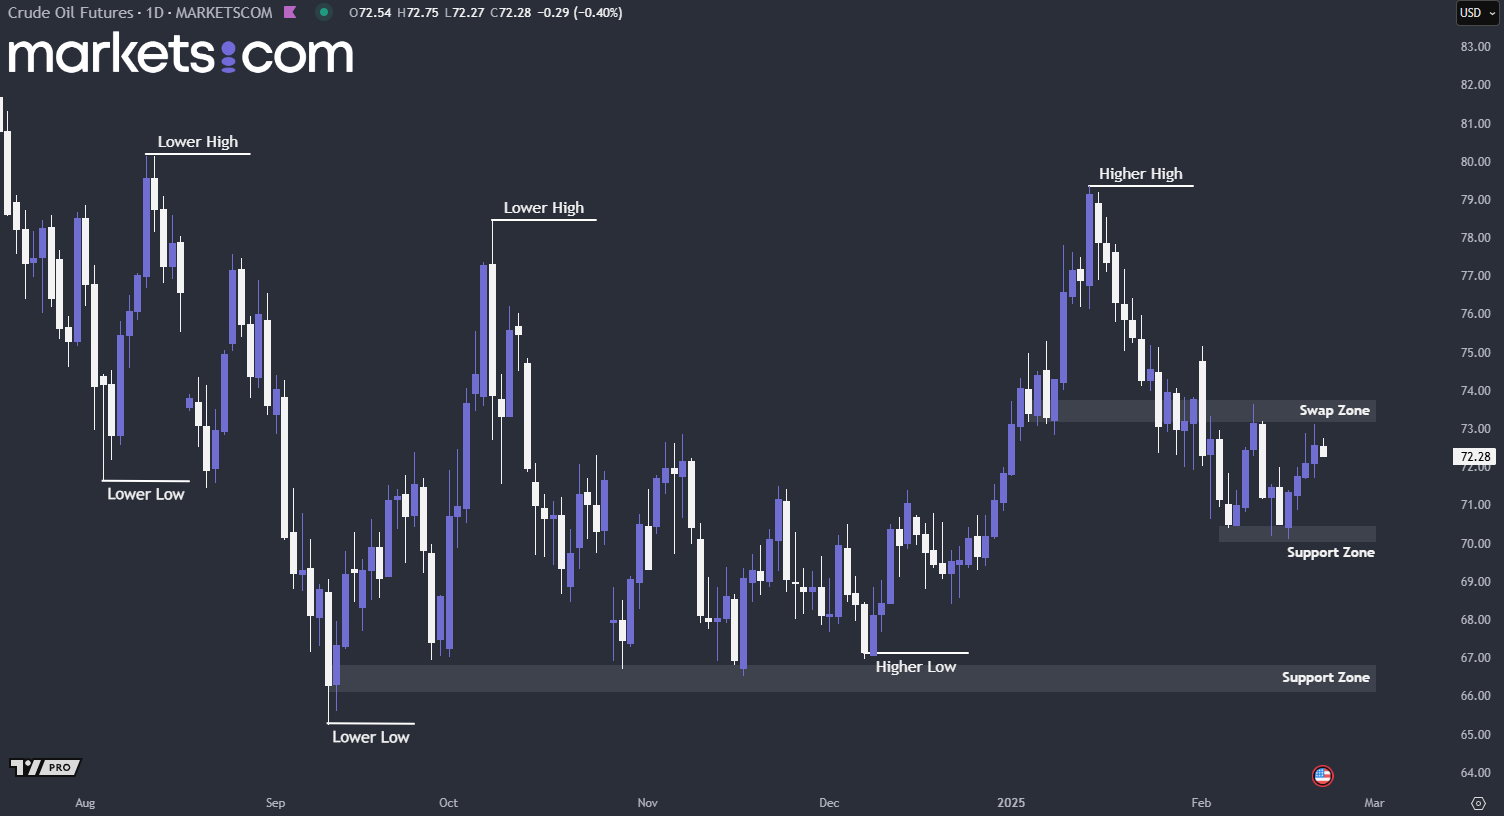
(U.S Crude Oil Future Daily Chart, Source: Trading View)
From a technical analysis perspective, the broader trend of crude oil futures remains bearish, as indicated by the lower highs and lower lows. In the recent trend, the price broke below the support zone with significant bearish momentum. However, the price found support and formed a double bottom on a lower timeframe, driving the price upwards to retest the swap zone. If the price fails to break above this swap zone, it is highly likely that bearish momentum will regain control, pushing the price downward.
In December 2024, UK retail sales saw a slight month-on-month decline of -0.3%, but there was a strong year-on-year increase of 3.6%. UK retail sales surged by a stronger-than-expected 1.7% in January, according to data released by the Office for National Statistics at 07:00 GMT on Friday. This suggests a stabilization in consumer spending as shoppers gradually return to their usual purchasing habits after the holiday season. However, the milder annual gain indicates that cost-of-living pressures and a tougher economic environment are still having an impact.

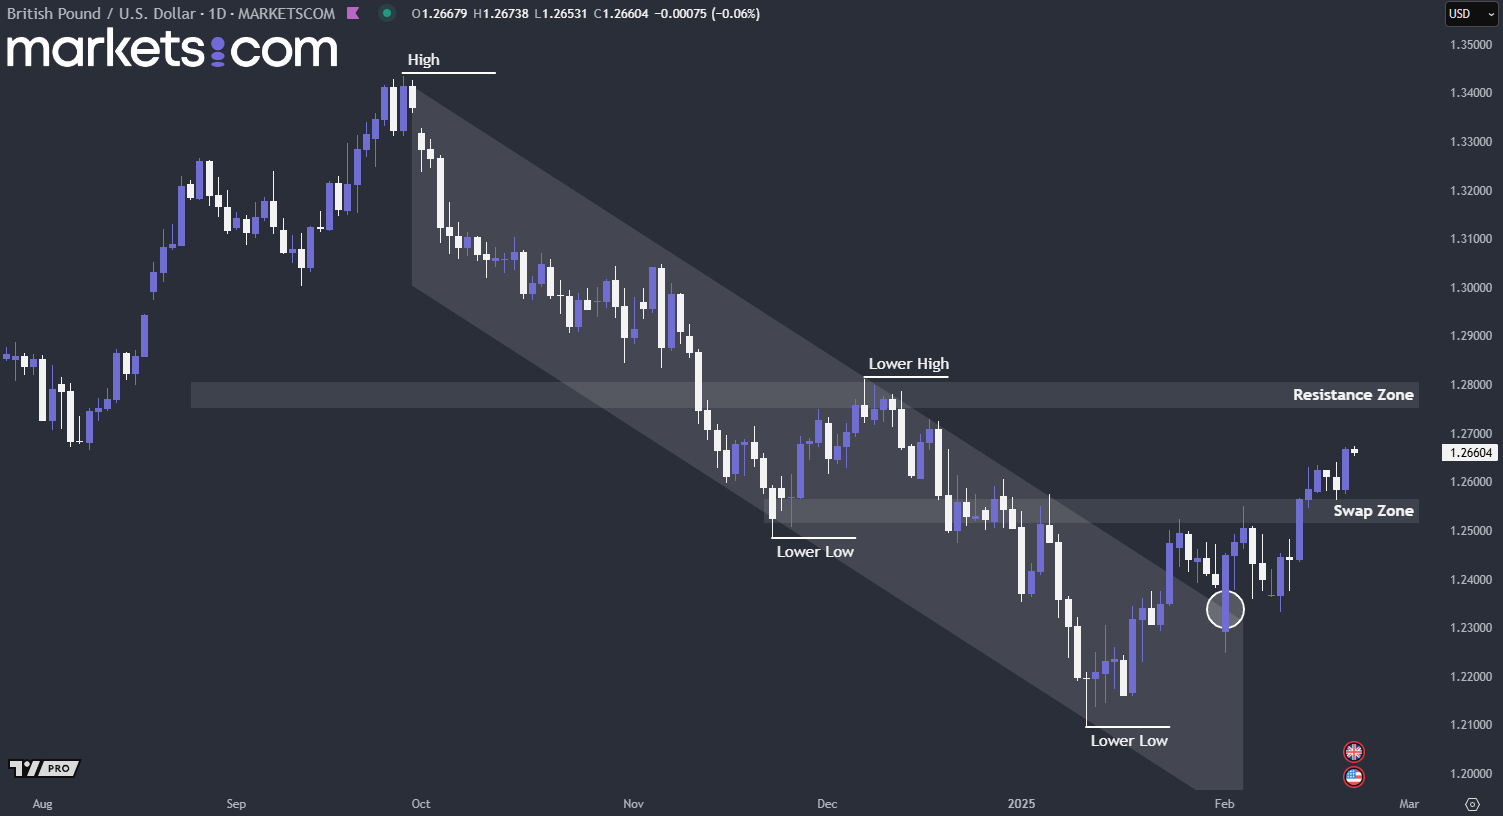
(GBP/USD Daily Chart, Source: Trading View)
From a technical analysis perspective, the recent price action has broken above the swap zone, indicating that bullish momentum has temporarily regained control. The price experienced a bullish correction, retested the swap zone, found support and surged upward, demonstrating a solid bullish structure. Therefore, it is highly likely that the price will continue to rise to retest the resistance zone above, providing a clearer indication of the overall trend thereafter.
In January 2025, the S&P Global Composite Purchasing Managers' Index (PMI) for the United States was recorded at 52.7, down from 55.4 in December 2024. This figure indicates that business activity continues to expand but at a slower rate. The slowdown was mainly attributed to a dip in the services sector, which saw its weakest growth in nine months, while the manufacturing sector showed signs of improvement with increased activity for the first time in six months.
The S&P Global Preliminary Composite PMI for February 2025, which will be released today at GMT 14:45, is expected to hold steady at 52.7, suggesting that business activity is neither picking up speed nor slowing down significantly. This stability may indicate a balanced performance between the manufacturing and services sectors, where the ongoing recovery in manufacturing is offset by slower growth in services.

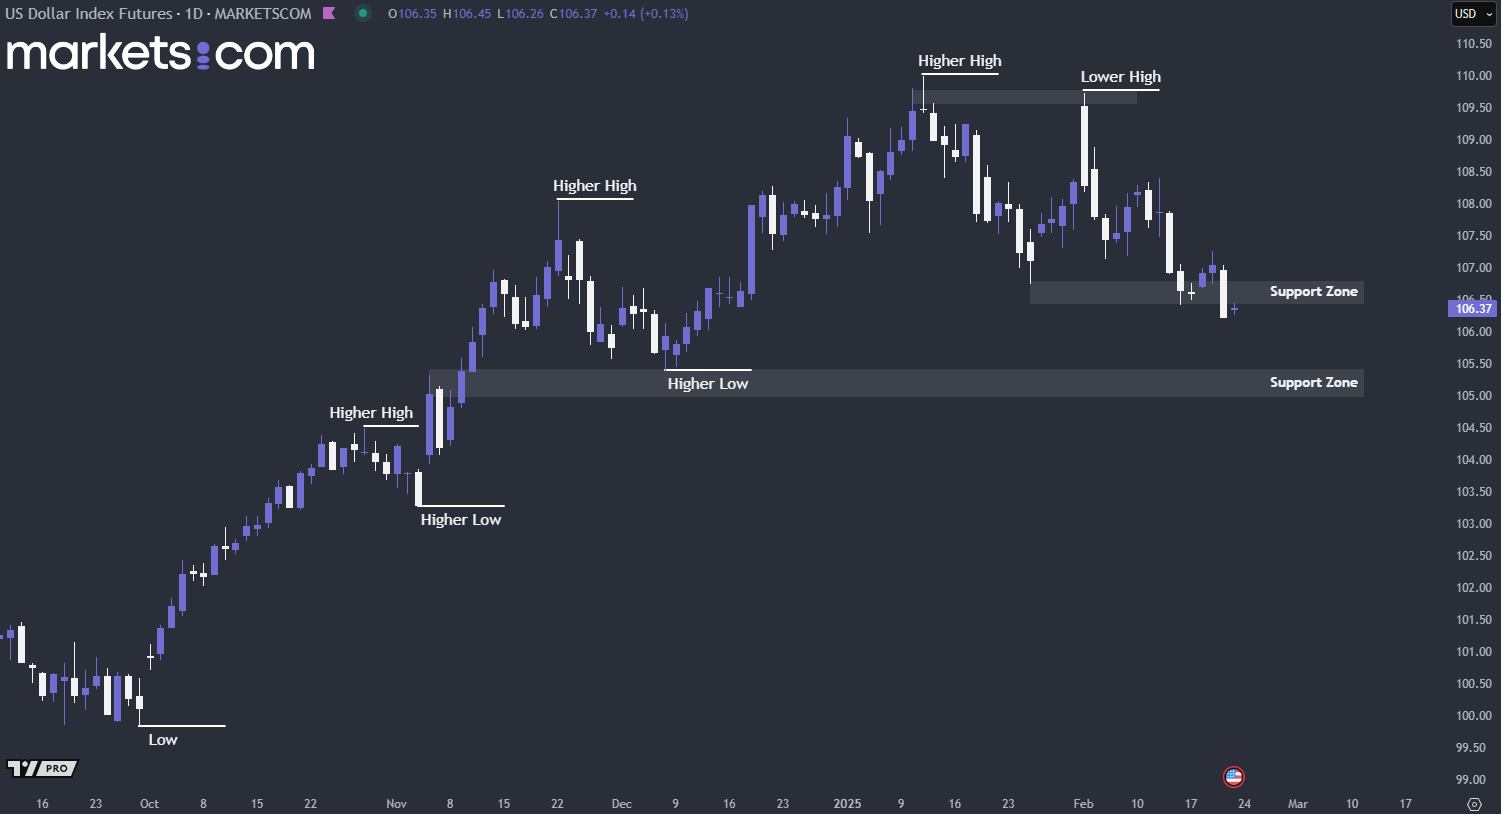
(U.S. Dollar Index Daily Chart, Source: Trading View)
From a technical analysis perspective, the broader trend for the U.S. dollar index remains bullish, as indicated by the higher highs and higher lows. However, it has started to move in a bearish trend since mid-January, forming lower highs and lower lows. Recently, it broke below the support zone with a solid breakout and significant bearish momentum. Such a strong bearish structure may likely lead the price downward, testing the support zone below.
Risk Warning and Disclaimer: This article represents only the author’s views and is for reference only. It does not constitute investment advice or financial guidance, nor does it represent the stance of the Markets.com platform. Trading Contracts for Difference (CFDs) involves high leverage and significant risks. Before making any trading decisions, we recommend consulting a professional financial advisor to assess your financial situation and risk tolerance. Any trading decisions based on this article are at your own risk.