Access Restricted for EU Residents
You are attempting to access a website operated by an entity not regulated in the EU. Products and services on this website do not comply with EU laws or ESMA investor-protection standards.
As an EU resident, you cannot proceed to the offshore website.
Please continue on the EU-regulated website to ensure full regulatory protection.
Tuesday Aug 12 2025 08:21

5 min

Australia’s central bank cut its main cash rate by 25 basis points to a two-year low of 3.60% on Tuesday, citing easing inflation and a softer labour market. Wrapping up a two-day policy meeting, the Reserve Bank of Australia (RBA) said updated forecasts showed core inflation was on track to moderate to the midpoint of its 2%–3% target range, assuming a gradual easing in policy.
Markets had widely anticipated the cut after being surprised in July when the RBA held rates steady. Data from the second quarter showed inflation slowing as desired, while unemployment edged higher. “With underlying inflation continuing to decline towards the midpoint of the 2–3% range and labour market conditions easing slightly, the Board judged that further monetary policy easing was appropriate,” the RBA said in its statement.

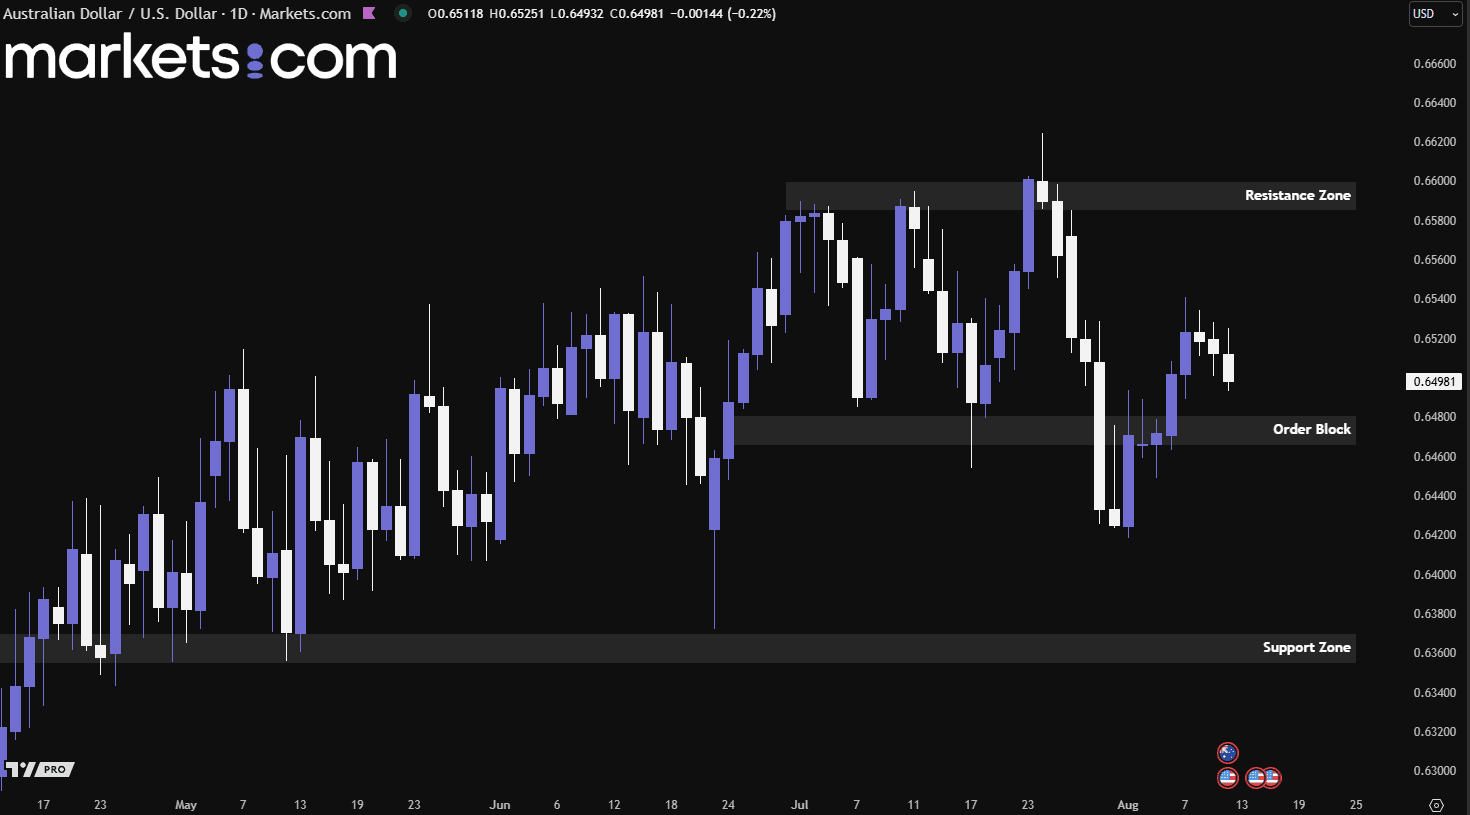
(AUD/USD Daily Chart, Source: Trading View)
From a technical analysis perspective, the AUD/USD currency pair has been trending bullishly, as indicated by higher highs and higher lows. Recently, it was rejected from the resistance zone of 0.6585 – 0.6600 but has since rebounded and closed above the order block at 0.6465 – 0.6480. However, the bullish momentum has begun to diminish, as shown by three consecutive bearish candles at the time of writing. Therefore, the pair may potentially drop to retest the order block again before determining its next direction.
The U.S. inflation rate (YoY) registered 2.7% in June, and market forecasts point to the same 2.7% reading for July. On a month-over-month basis, inflation increased 0.3% in June, with July’s figure expected to ease slightly to 0.2%. These data are set to be released today on 1230 GMT.
The unchanged YoY projection reflects expectations that annual price growth has stabilised, as easing goods prices and softer energy costs offset stubborn service inflation. The slight moderation in the MoM forecast suggests that near-term price momentum may be cooling, possibly due to weaker demand in certain sectors, seasonal price normalisation, and easing supply chain pressures. Together, these projections imply that inflation is holding steady on an annual scale but showing signs of slowing in the short term.

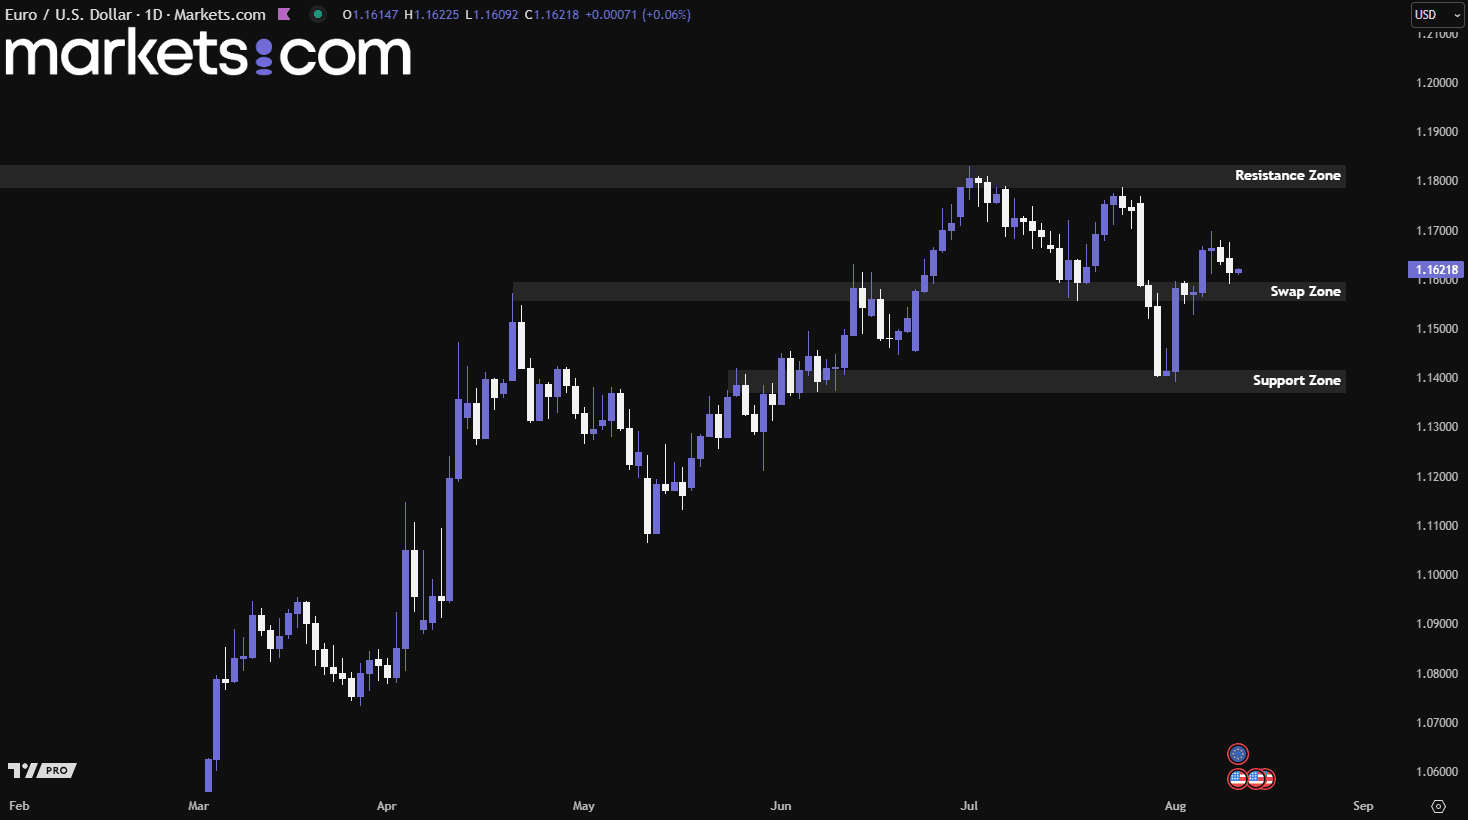
(EUR/USD Daily Chart, Source: Trading View)
From a technical analysis perspective, the EUR/USD currency pair has been in a bullish trend since mid-January 2025, as shown by its pattern of higher highs and higher lows. Recently, it rebounded from the support zone of 1.1370 – 1.1420, surged upward, and broke above the swap zone of 1.1560 – 1.1600. However, bullish momentum appears to be fading, with the pair pulling back to retest the swap zone. If it can regain upward momentum from this level, it may potentially rally toward the resistance zone of 1.1785 – 1.1835. Conversely, if the zone fails to hold, the pair could drop lower to retest the support area.
Ethereum’s year-to-date performance has now edged ahead of Bitcoin, fueled by a surge in institutional demand. Digital Asset Treasury (DAT) companies have been stockpiling ETH, while exchange-traded funds such as BlackRock’s ETHA have seen rising inflows. Over the past month, ETH has climbed more than 45%, breaking above $4,300 and setting its sights on the $5,000 milestone. This rally has been driven by unprecedented whale accumulation, strong institutional buying, and growing regulatory clarity in the U.S.
In the last four weeks alone, Ethereum-focused investment products have attracted over $4.17 billion in inflows, with major players like Galaxy Digital, FalconX, and BitGo facilitating large-scale purchases. One unnamed institution reportedly bought 221,166 ETH, nearly $1 billion worth in just one week, underscoring long-term confidence even at elevated price levels.

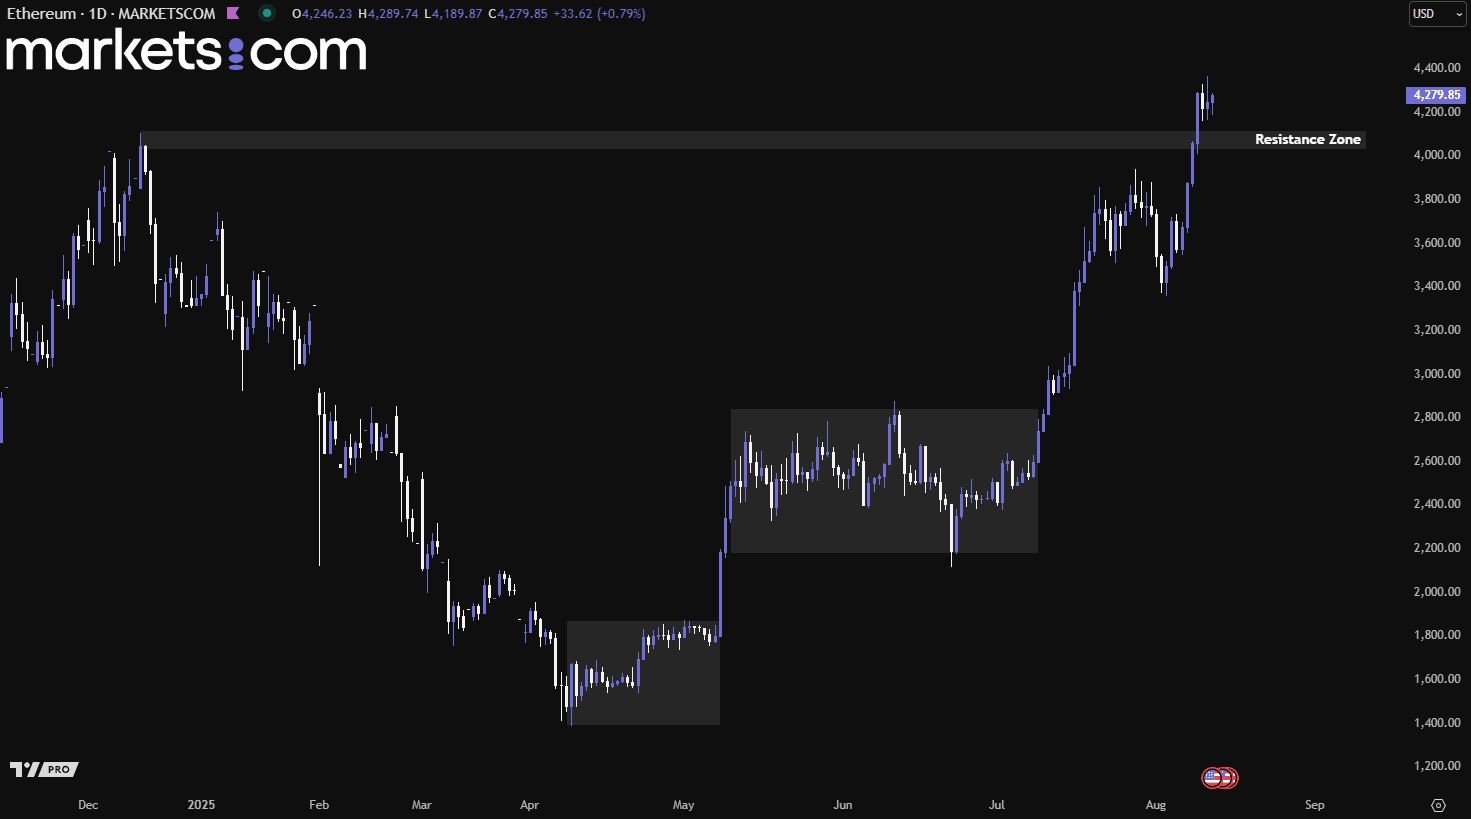
(Ethereum Daily Price Chart, Source: Trading View)
From a technical analysis perspective, Ethereum has been in a bullish trend since mid-April 2025, as indicated by its pattern of higher highs and higher lows. Recently, it broke above the previous high and the resistance zone of 4,030 – 4,120, indicating that bullish momentum is firmly in control. This strong upward movement could potentially drive the price higher to retest the all-time high near 4,850.
Risk Warning and Disclaimer: This article represents only the author’s views and is for reference only. It does not constitute investment advice or financial guidance, nor does it represent the stance of the Markets.com platform. Trading Contracts for Difference (CFDs) involves high leverage and significant risks. Before making any trading decisions, we recommend consulting a professional financial advisor to assess your financial situation and risk tolerance. Any trading decisions based on this article are at your own risk.