Access Restricted for EU Residents
You are attempting to access a website operated by an entity not regulated in the EU. Products and services on this website do not comply with EU laws or ESMA investor-protection standards.
As an EU resident, you cannot proceed to the offshore website.
Please continue on the EU-regulated website to ensure full regulatory protection.
Tuesday Jun 30 2026 08:26

5 min

Brent crude futures traded steadily above $73 per barrel on Tuesday, sustaining the prior session's gains as market focus turned to the resumption of US-Iran peace negotiations in Doha, though divergent statements from both parties continued to introduce uncertainty. Iran reiterated its position that it would maintain oversight of Strait of Hormuz transit even in the event of Oman's non-participation. The current interim arrangement provides for a 60-day suspension of transit fees, but leaves open the possibility of future charges, a provision opposed by the US, European nations, and Gulf Arab states. Shipping volumes through the strategic chokepoint declined over the weekend following clashes that damaged two vessels, though tanker operators have indicated a continued readiness to navigate the route. Brent crude is projected to record a monthly decline of nearly 20% and a quarterly decline of over 23%, reflecting the combined effects of peace progress and anticipated increases in Persian Gulf oil flows.
We can see on our daily chart of Brent crude oil that the price fell all the way to the levels, which were seen at the start of the conflict between US and Iran. The commodity is now trading roughly around the 73-dollar mark. If the bears remain in control and Brent falls not only below the 73.00 zone, but also below the low of last week, at 71.93, that will confirm a forthcoming lower low, possibly inviting even more sellers into the game. That’s when we may shift our attention to some lower support areas, at around 69.16, or even at 63.27. The latter one has been a good support zone from the 15(th) to 22(nd) January.
Alternatively, in order to get comfortable in examining higher areas, we would prefer to wait for a violation of a short-term downside resistance line, drawn from the high of 18(th) May. This could lead to a change in the direction of the current short-term trend, possibly opening the door towards higher areas. We might then aim for the next potential resistance zone, at 82.30, or even at 86.09, marked by the high of 22(nd) June and the inside swing low of 17(th) April. Slightly above all that lies another possible resistance hurdle, at 89.93, which marks the low of 29(th) of May.
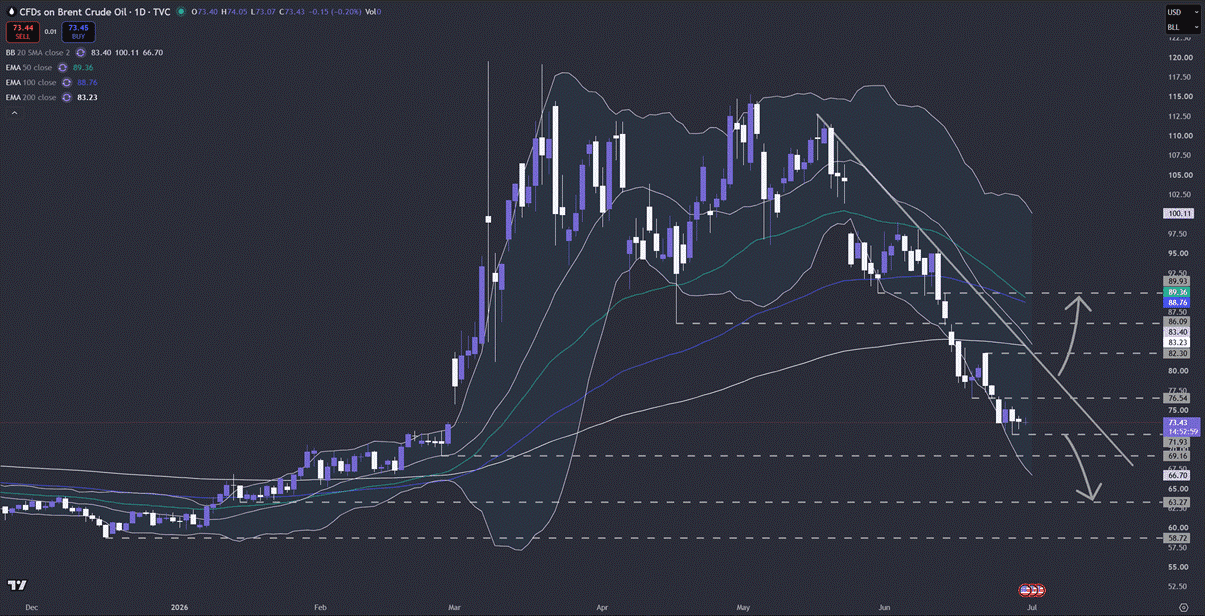
(Brent oil daily chart. Source: tradingview.com)
Japan's currency has plunged to depths not seen in nearly four decades, with the yen breaching 162 against the dollar on Tuesday, its weakest since 1986, and sending a fresh jolt of anxiety through Tokyo's policy circles, where officials are now weighing the prospect of stepping into the market to stem the slide. The yen is being crushed by a remorseless arithmetic: the gulf between Japan's near-zero rates and America's tightening cycle is as vast as ever, with the Fed poised for multiple hikes this year while the BOJ inches forward with agonizing caution. Carry traders are feasting on the spread, and the dollar's safe-haven allure is only adding insult to injury. All of this comes against a backdrop of profound vulnerability, Japan relies on Middle Eastern oil for its energy needs, and any hiccup in supply could have outsized consequences. May's disappointing industrial production reading is a case in point, highlighting how regional tensions are already crimping supply chains and inflating energy bills. The yen's fall is more than a currency story; it is a mirror of Japan's fragile position in a turbulent world.
After breaking the 162.00 barrier, it seems that the bulls continue to show willingness to keep USDJPY above that barrier. It is currently acting as a psychological zone, which is suggesting that it might be seen as a strong support area. If the pair continues to trade above that area, we will continue aiming higher, where our next possible resistance target could be at 164.20, marked by the highest point of December 1986. Slightly above it sits another potential resistance level, at 165.00, marked by the highest point of November 1986.
For us to shift our attention to some lower areas, we would prefer to wait for a drop all the way somewhere below the 160.50 hurdle, marked by the highest point of March. A further slide could bring the rate closer to the 159.65 obstacle, or we could even see a re-test of the long-term upside support line, drawn from the lowest point of 2025.
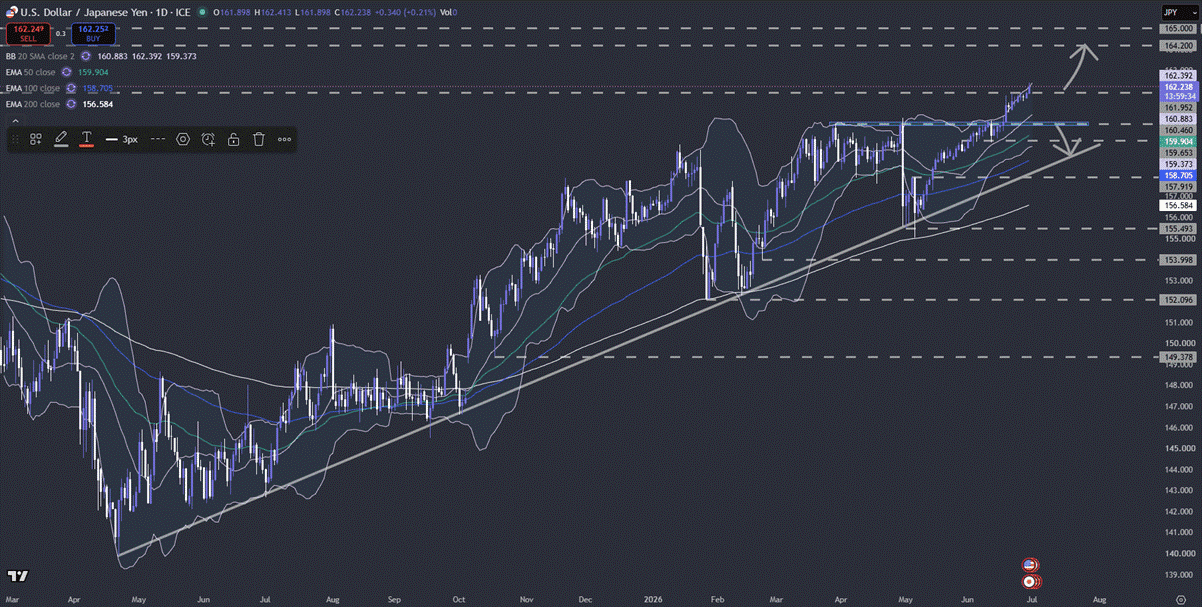
(USDJPY oil daily chart. Source: tradingview.com)
Risk Warning: This article is provided for informational purposes only and does not constitute investment advice, investment research, or a recommendation to trade. The views expressed are those of the author and do not necessarily reflect the position of Markets.com. When considering shares, indices, forex (foreign exchange), and commodities for trading and price predictions, remember that trading CFDs involves a significant degree of risk and may not be suitable for all investors. Leveraged products can result in capital loss. Past performance is not indicative of future results. Before trading, ensure you fully understand the risks involved and consider your investment objectives and level of experience. Cryptocurrency CFD trading restrictions may apply depending on jurisdiction.
Latest
View all
Monday, 29 June 2026
6 min

Monday, 29 June 2026
9 min

Monday, 29 June 2026
5 min

Tuesday, 30 June 2026
Indices
Bitcoin Price Outlook: Could BTC Fall Toward $53,000 After Losing $60,000 Support?

Tuesday, 30 June 2026
Indices
Brent Holds Above $73 as Iran Talks Uncertainty Offsets Hormuz Recovery

Tuesday, 30 June 2026
Indices
Gold Price Today, July 1: Spot Gold Faces Worst Quarterly Loss in 13 Years

Tuesday, 30 June 2026
Indices
AMD Stock Hits Record High as AI Chip Optimism Lifts Semiconductor Sentiment

Monday, 29 June 2026
Indices
USD/JPY Breaks Above 162 as Yen Hits 40-Year Low Despite Japan’s Economic Resilience


