
Access Restricted for EU Residents
You are attempting to access a website operated by an entity not regulated in the EU. Products and services on this website do not comply with EU laws or ESMA investor-protection standards.
As an EU resident, you cannot proceed to the offshore website.
Please continue on the EU-regulated website to ensure full regulatory protection.
Friday Aug 14 2026 08:44

40 min

The FTSE 100 is the best-known benchmark for large companies listed in London and one of the world’s most closely followed equity indices. Because the index is a calculated benchmark rather than an asset, you cannot buy it directly. Instead, you can gain exposure through products such as exchange-traded funds, futures and contracts for difference. CFDs provide flexible long or short access, but their leverage and margin requirements create substantial risk.
This guide explains how to trade FTSE 100 markets through CFD trading, covering index mechanics, trading hours, price drivers, strategies, costs, worked examples and practical risk controls.
The FTSE 100 is a stock market index comprising 100 of the most highly capitalised blue-chip companies listed on the London Stock Exchange. Launched in 1984 with a base value of 1,000 points, it is maintained by FTSE Russell and commonly used as a measure of UK large-cap equity performance.
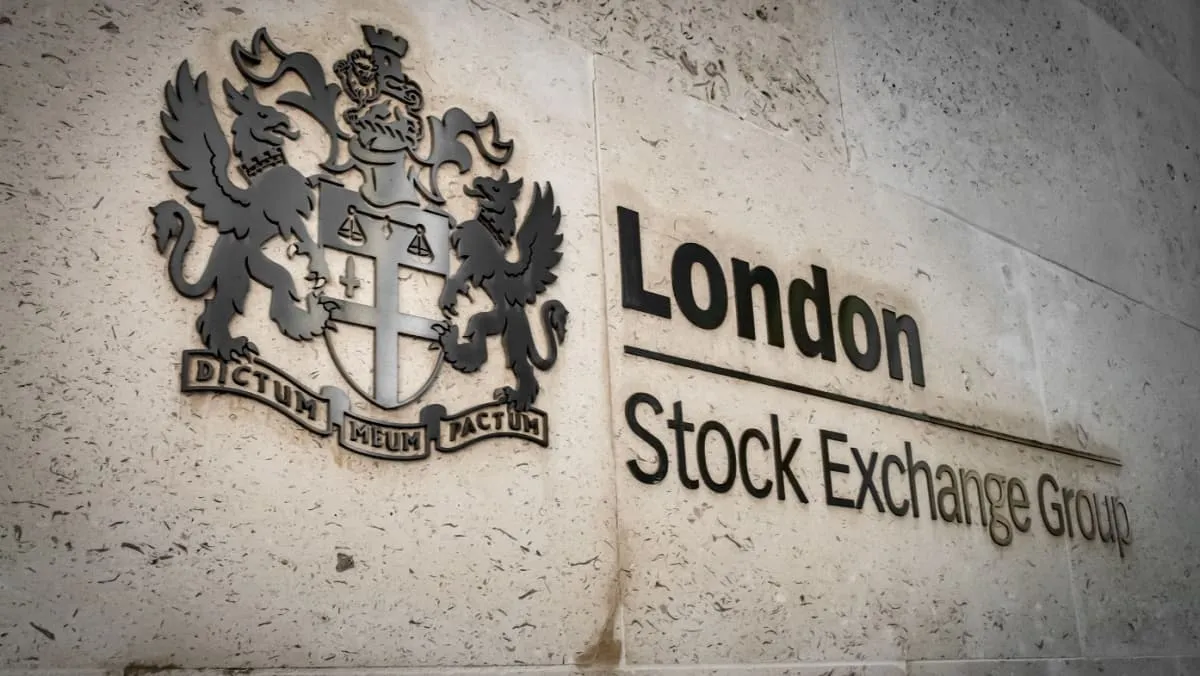
The index contains businesses from banking, energy, healthcare, consumer goods, industrials, mining and other sectors. However, it should not be treated as a direct measure of the domestic UK economy. Many constituents operate globally and generate substantial revenue outside the UK.
FTSE 100 is the name of the underlying benchmark, while UKX is its widely used index identifier. “Footsie” is an informal name for the same index.
UK100 or UK 100 normally refers to a broker’s tradable product that follows the FTSE 100. For example, a UK 100 CFD derives its value from the index but does not give the trader ownership of the index or its companies.
The UK100 CFD price may differ slightly from the official cash index because of spreads, financing, dividends, futures pricing and extended-hours market conditions. Traders should therefore check the precise instrument instead of assuming every UK100 product is identical.

FTSE Russell selects companies under a rules-based process and reviews the index quarterly. Constituents can be added or removed as their market values change. The June 2026 review, for example, added Aberdeen Group, Computacenter and Investec while removing Berkeley Group Holdings, Mondi and Rightmove.
The following tracker weights provide a dated snapshot of the largest constituents:
Company | Approximate weight |
|---|---|
HSBC Holdings | 9.8% |
AstraZeneca | 8.5% |
Shell | 6.6% |
Rolls-Royce Holdings | 4.9% |
Unilever | 3.8% |
British American Tobacco | 3.8% |
GSK | 3.2% |
Rio Tinto | 3.0% |
BP | 2.9% |
Barclays | 2.8% |
Data reflects a FTSE 100 tracker as at 30 June 2026. Weights move with share prices and should be updated before publication or trading analysis.
These companies show why financials, healthcare, energy, industrials, consumer staples and basic materials can strongly influence FTSE 100 trading.
The index is weighted by free-float-adjusted market capitalisation. Market capitalisation is broadly calculated by multiplying a company’s share price by its shares in issue. The free-float adjustment then excludes shares not considered readily available for public trading.
A company with a larger adjusted market value receives a larger index weight. A 2% move in a major constituent such as HSBC or AstraZeneca should therefore affect the FTSE 100 more than the same percentage move in a smaller constituent.
A divisor converts the combined market value into a manageable index level. It can be adjusted for corporate actions such as share issues or mergers so that these events do not create artificial index jumps. FTSE Russell reviews membership quarterly while accounting for eligible corporate events between reviews.
Trading the FTSE 100 provides exposure to a basket of large companies through one market. It can be useful for traders who want to express a view on UK-listed blue chips without analysing and trading every constituent separately.
That broad exposure does not eliminate risk:
Potential Feature | Important Limitation |
|---|---|
One position provides exposure to multiple sectors | Large companies and sectors can dominate performance |
The index attracts substantial attention during London hours | Liquidity and spreads may change outside the cash session |
Economic and corporate catalysts create regular movement | News can produce gaps and rapid volatility |
CFDs generally support long and short positions | Both directions can produce losses |
Margin reduces the initial capital needed for a position | Leverage increases exposure and magnifies losses |
Extensive historical data supports analysis | Historical patterns do not guarantee future behaviour |
The FTSE 100’s long history also provides data covering expansions, recessions, financial crises and periods of changing interest rates. Historical comparisons should distinguish between the price index and total-return measures that include reinvested dividends. Past performance does not predict future results.
You cannot purchase the FTSE 100 directly because it is a calculated index. Instead, you must choose a financial product designed to track or derive its price from the benchmark.
Feature | CFDs | ETFs | Futures |
|---|---|---|---|
Ownership | No ownership of index shares | Ownership of fund shares | No ownership of index shares |
Long and short access | Generally available | Shorting requires separate facilities | Available |
Leverage | Yes, subject to product and jurisdiction | Usually unleveraged, although leveraged ETFs exist | Yes |
Expiry | Cash CFDs normally have no fixed expiry | No fixed expiry | Fixed contract expiry |
Typical costs | Spread, financing and adjustments | Dealing costs, fund fee and tracking difference | Spread, commission and rollover |
Common use | Shorter-term speculation | Longer-term market exposure | Trading, hedging and professional market access |
Availability, taxation and regulation differ between jurisdictions. The comparison describes common product characteristics rather than recommending one method.
A CFD is an agreement to exchange the difference between the opening and closing prices of a market. If you buy a FTSE 100 CFD and the price rises, the position gains value. If it falls, the position loses value. A sell position works in the opposite direction.
The basic calculation is:
Profit or loss = price movement in points × value per point
Suppose the index moves 30 points and your position is worth £2 per point. The gross change is £60. Whether that is a profit or loss depends on your direction. Spreads, financing, adjustments and slippage must then be included to calculate the net result.
CFDs use margin, meaning you deposit only part of the position’s full notional value. Margin is not the maximum possible loss. A relatively small index movement can have a substantial effect on your account when the position is highly leveraged.
A cash or spot-style UK 100 CFD is designed to follow the current index level. It normally has no fixed expiry, but overnight financing may accumulate when the position remains open beyond the provider’s daily cut-off.
A futures-based CFD references a FTSE 100 futures contract. Its price incorporates expectations about financing and dividends until expiry, so it may trade above or below the cash index. It may also require expiry management or rollover into a later contract.
Cash CFDs are often used for shorter holding periods because their pricing closely follows the spot-style index. Futures-based products may be considered for positions held over a longer period, but this does not automatically make them cheaper. Spreads, financing policies, expiry dates and rollover arrangements must be compared using current product terms.
FTSE 100 trading hours depend on whether you mean the underlying London share market, an exchange-listed derivative or a broker’s UK100 CFD. These schedules should not be treated as interchangeable.
The London Stock Exchange’s core cash-equity session runs from 08:00 to 16:30 London time on normal trading days. For UAE traders, this corresponds to 11:00–19:30 GST while the UK observes British Summer Time and 12:00–20:30 GST during the UK winter.
A CFD provider may quote the UK 100 beyond those hours using futures prices, related markets and internal pricing inputs. Markets.com publishes separate schedules for its instruments, and the latest times should be checked because holidays, daylight-saving changes and maintenance periods can alter access.
Extended access does not mean that liquidity is constant. Spreads can widen and prices can react sharply when the underlying shares are closed.
Activity often increases around the London open as overnight information is reflected in constituent share prices. UK inflation data, employment figures, GDP releases and Bank of England announcements can also produce concentrated volatility.
The US market open creates another active period because London and New York sessions overlap. Global risk sentiment, commodity prices and movements in US equities can then influence UK100 pricing before London closes.
There is no universal best time to trade. More active periods may offer stronger liquidity, but they can also produce faster losses, slippage and false breakouts. The suitable session depends on the strategy and the trader’s ability to monitor the position.
The visible market movement is not the same as the trader’s net result. Relevant costs can include:
Costs vary by instrument and legal entity. Current spreads, margin requirements, financing terms and trading hours should therefore be reviewed before every trade.
The FTSE 100 responds to domestic UK developments, but its multinational companies also make it sensitive to currencies, commodities and global economic conditions.
Many FTSE 100 companies earn revenue in dollars, euros and other currencies. When sterling weakens, foreign earnings can become more valuable after translation into pounds, potentially supporting some multinational shares. A stronger pound can create the opposite effect.
This is a tendency rather than a fixed trading rule. Sterling may fall because of severe economic concerns that also hurt equities, while company hedging policies can reduce currency effects.
Energy and mining companies also give the index meaningful exposure to oil, natural gas and metals. Higher commodity prices may support producers’ earnings expectations, while falling prices can weigh on the relevant sectors. Banks, healthcare companies and defensive consumer businesses introduce different sensitivities.
Key FTSE 100 catalysts include:
Catalyst | Possible transmission to the index |
|---|---|
Bank of England policy | Changes borrowing costs, bond yields, and company valuations |
UK inflation and growth | Influences rate expectations and business outlooks |
Sterling | Changes the translated value of overseas earnings |
Oil and metal prices | Affects major energy and mining constituents |
Global risk sentiment | Moves internationally exposed shares and demand for risk assets |
Company results | Large constituents can move the weighted index |
Quarterly reviews | Creates expected buying and selling around additions and deletions |
Traders should monitor the economic calendar alongside company earnings and dividend dates. A strong domestic data release does not guarantee an index rise because the market may focus instead on higher rate expectations, sterling strength or weakness in global commodities.
A FTSE 100 strategy should define when a trade is allowed, how risk is measured and what invalidates the original idea. An indicator or price pattern alone is not a complete plan.
A practical top-down process can include:
Fundamental analysis helps explain why the market may move, while technical analysis helps organise timing and risk. Neither approach removes uncertainty.
Strategy | Suitable market condition | Main risk |
|---|---|---|
Trend following | Sustained higher highs or lower lows | Entering after the move is overextended |
Breakout trading | Price compresses near a defined boundary | False breakouts and rapid reversals |
Range trading | Repeated reactions between support and resistance | A genuine breakout invalidates the range |
News trading | A scheduled event creates repricing | Gaps, slippage, and unpredictable spreads |
Trend traders might use moving averages and price structure to confirm direction. Breakout traders may wait for a close beyond resistance or support rather than reacting to the first price spike. Range traders focus on fading repeated boundaries, while news traders require careful control because execution can deteriorate during major announcements.
Assume the UK100 is trading at a hypothetical 10,000 points. A trader identifies an upward trend and plans the following position:
The planned cash risk is:
40 points × £2 = £80
The potential gross profit is:
80 points × £2 = £160
This produces a planned reward-to-risk ratio of 2:1 before costs. The position’s notional value is £20,000 because 10,000 points multiplied by £2 per point equals £20,000. The required margin would be that notional value multiplied by the applicable margin rate.
The £80 figure is not guaranteed. A gap below the stop could lead to a worse execution price, while the spread and any overnight financing would reduce the net result. A short example uses the same calculation with the stop above the entry and the target below it.
Position size should be derived from the planned cash loss and stop distance:
Value per point = maximum intended cash loss ÷ stop distance
A trader willing to accept an £80 planned loss with a 40-point stop arrives at £2 per point. This is an illustration, not a universal risk allowance.
Risk management should also account for:
A demo account can help test execution and position-sizing calculations before real capital is used.
For UAE traders, moving from index analysis to practical trading requires attention to regulation, GST market hours and the FTSE 100’s international price drivers.
Regulatory checks, market research and disciplined risk controls are essential because leveraged index positions can lose value quickly.
A FTSE 100 CFD allows you to speculate on the index’s price without owning the benchmark or its constituent shares. You can take a long position when anticipating a rise or a short position when anticipating a fall.
Step 1: Open an Account
Visit Markets.com, and sign up with your email or a Google, Facebook, or Apple account.

Step 2: Verify Your Identity
Complete the KYC check: enter your country, personal details, and a few risk-assessment answers, then upload your proof of ID.
Tip: While your ID is under review, open the demo account to see how index prices move and test a strategy risk-free.
Step 3: Fund Your Account
Deposit via card, bank transfer, e-wallet, Apple Pay, or Google Pay. Only fund what you're prepared to risk—leverage cuts both ways.

Step 4: Find FTSE 100 and Place the Trade
Search for the platform’s UK 100 instrument. Check whether you are viewing the cash-style or futures-based product, then review its spread, point value, margin requirement, financing terms and trading hours.
Choose Buy for a long position or Sell for a short position. Enter the position size only after calculating the planned cash risk and confirming the full market exposure.

Step 5: Manage Your Risk
Set a stop-loss and take-profit before you enter, and watch the economic calendar—index prices react sharply to rate decisions, inflation data, and earnings.
New to Markets.com? Claim a generous deposit bonus on your first trade. Hurry—this offer is only available for a limited time.

Learning how to trade FTSE 100 markets requires understanding both the index and the product used to access it. The FTSE 100 combines large multinational businesses, making it sensitive to sterling, commodities, interest rates, company results and global sentiment. CFDs allow long and short positions without ownership, but leverage, margin, spreads, financing and slippage can increase risk. Before placing a UK100 trade through Markets.com or another provider, verify the instrument’s current conditions, calculate the potential cash loss and define the entry, stop and target. A consistent process matters more than predicting every market move.
The FTSE 100 is the underlying stock market index, while UK100 or UK 100 usually refers to a broker’s tradable product tracking it. A UK100 CFD should follow the index closely, but its quoted price can differ because of spreads, financing and out-of-hours pricing.
The underlying London cash session is not open 24 hours. Some CFD providers offer extended UK100 trading by referencing futures and related markets, but daily breaks, weekends, holidays and maintenance periods still apply. Always check the specific instrument’s current schedule.
Liquidity is often strongest during the London session, particularly around the open, UK economic announcements, the US-market overlap and the close. These periods can also be more volatile, so the appropriate time depends on your strategy and ability to manage rapid price movements.
The amount depends on the minimum position size, value per point, margin rate, stop distance and acceptable cash loss. The minimum margin needed to open a CFD should not be confused with a suitable account balance or the maximum amount that could be lost.
FTSE 100 CFDs generally allow traders to open a sell position when they expect the index to decline. The position gains if the price falls and loses if it rises. Short trades remain exposed to leverage, gaps, financing, slippage and potentially rapid losses.
CFD traders do not own the constituent shares and therefore do not receive shareholder dividends. Instead, a broker may apply dividend-related cash or price adjustments when constituents trade ex-dividend. The treatment can differ for long and short positions, so the product terms should be checked.
Nasdaq 100 Index 2026 Forecast: Can It Finish Above 30,000?
S&P 500 Forecast and Predictions for 2026, 2027 and 2030
Russell 2000 Index: What It Is and How to Trade It
How to Trade Indices CFDs in the UAE: A Complete Guide
How to Trade the Nasdaq-100 from the UAE 2026
Index Trading Strategies for 2026
Index CFDs vs ETFs vs Futures: Which Is Best?
10 Best Index Trading Platforms in the UAE 2026
What Is a Stock Index? Everything You Need to Know
Global Index CFDs Guide 2026 | How to Trade Index CFDs
Index Trading Hours: Best Time to Trade Indices in the UAE
How to Trade the JSE Top 40 Index: Comprehensive Strategy and Tips Guide
How to Trade the DAX 40 from the UAE
Risk Warning: This article is provided for informational purposes only and does not constitute investment advice, investment research, or a recommendation to trade. The views expressed are those of the author and do not necessarily reflect the position of Markets.com. When considering shares, indices, forex (foreign exchange), and commodities for trading and price predictions, remember that trading CFDs involves a significant degree of risk and may not be suitable for all investors. Leveraged products can result in capital loss. Past performance is not indicative of future results. Before trading, ensure you fully understand the risks involved and consider your investment objectives and level of experience. Cryptocurrency CFD trading restrictions may apply depending on jurisdiction.
Latest
View all
Thursday, 13 August 2026
31 min

Thursday, 13 August 2026
40 min

Wednesday, 12 August 2026
36 min


 EN
EN





